

24 Processed EEG as a Measure of Brain Activity During Anaesthesia
375
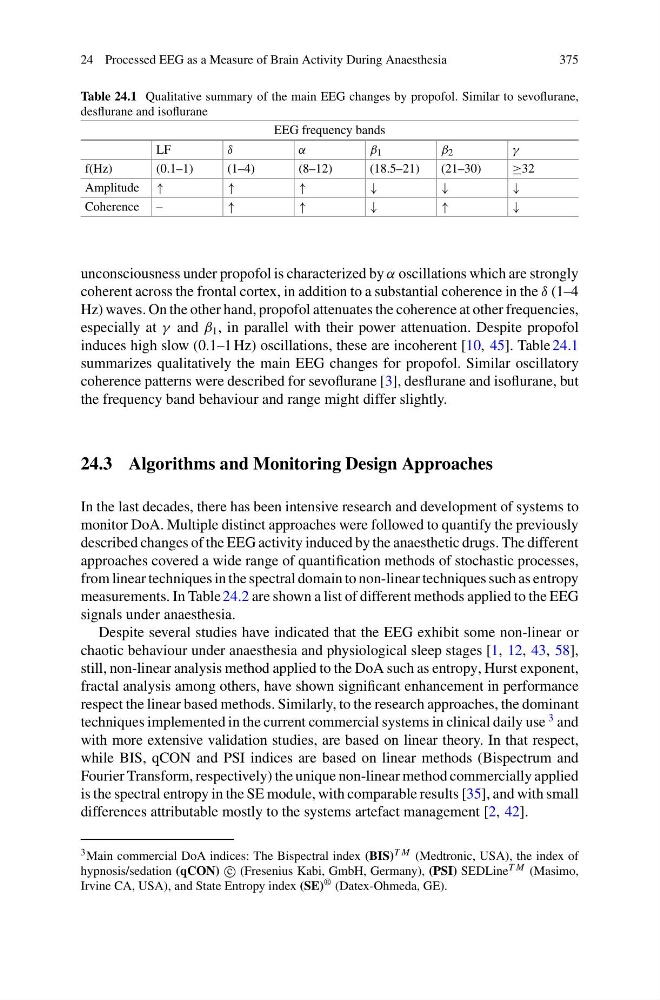
Table 24.1 Qualitative summary of the main EEG changes by propofol. Similar to sevoflurane,
desflurane and isoflurane
EEG frequency bands
LF
δ
α
β 1
β 2
γ
f(Hz)
(0.1–1)
(1–4)
(8–12)
(18.5–21)
(21–30)
≥32
Amplitude ↑
↑
↑
↓
↓
↓
Coherence –
↑
↑
↓
↑
↓
unconsciousness under propofol is characterized by α oscillations which are strongly
coherent across the frontal cortex, in addition to a substantial coherence in the δ (1–4
Hz) waves. On the other hand, propofol attenuates the coherence at other frequencies,
especially at γ and β 1 , in parallel with their power attenuation. Despite propofol
induces high slow (0.1–1 Hz) oscillations, these are incoherent [10, 45]. Table 24.1
summarizes qualitatively the main EEG changes for propofol. Similar oscillatory
coherence patterns were described for sevoflurane [3], desflurane and isoflurane, but
the frequency band behaviour and range might differ slightly.
24.3 Algorithms and Monitoring Design Approaches
In the last decades, there has been intensive research and development of systems to
monitor DoA. Multiple distinct approaches were followed to quantify the previously
described changes of the EEG activity induced by the anaesthetic drugs. The different
approaches covered a wide range of quantification methods of stochastic processes,
from linear techniques in the spectral domain to non-linear techniques such as entropy
measurements. In Table 24.2 are shown a list of different methods applied to the EEG
signals under anaesthesia.
Despite several studies have indicated that the EEG exhibit some non-linear or
chaotic behaviour under anaesthesia and physiological sleep stages [1, 12, 43, 58],
still, non-linear analysis method applied to the DoA such as entropy, Hurst exponent,
fractal analysis among others, have shown significant enhancement in performance
respect the linear based methods. Similarly, to the research approaches, the dominant
techniques implemented in the current commercial systems in clinical daily use
3 and
with more extensive validation studies, are based on linear theory. In that respect,
while BIS, qCON and PSI indices are based on linear methods (Bispectrum and
Fourier Transform, respectively) the unique non-linear method commercially applied
is the spectral entropy in the SE module, with comparable results [35], and with small
differences attributable mostly to the systems artefact management [2, 42].
3 Main commercial DoA indices: The Bispectral index (BIS) T M (Medtronic, USA), the index of
hypnosis/sedation (qCON) c
(Fresenius Kabi, GmbH, Germany), (PSI) SEDLine T M (Masimo,
Irvine CA, USA), and State Entropy index (SE) ® (Datex-Ohmeda, GE).
375
Table 24.1 Qualitative summary of the main EEG changes by propofol. Similar to sevoflurane,
desflurane and isoflurane
EEG frequency bands
LF
δ
α
β 1
β 2
γ
f(Hz)
(0.1–1)
(1–4)
(8–12)
(18.5–21)
(21–30)
≥32
Amplitude ↑
↑
↑
↓
↓
↓
Coherence –
↑
↑
↓
↑
↓
unconsciousness under propofol is characterized by α oscillations which are strongly
coherent across the frontal cortex, in addition to a substantial coherence in the δ (1–4
Hz) waves. On the other hand, propofol attenuates the coherence at other frequencies,
especially at γ and β 1 , in parallel with their power attenuation. Despite propofol
induces high slow (0.1–1 Hz) oscillations, these are incoherent [10, 45]. Table 24.1
summarizes qualitatively the main EEG changes for propofol. Similar oscillatory
coherence patterns were described for sevoflurane [3], desflurane and isoflurane, but
the frequency band behaviour and range might differ slightly.
24.3 Algorithms and Monitoring Design Approaches
In the last decades, there has been intensive research and development of systems to
monitor DoA. Multiple distinct approaches were followed to quantify the previously
described changes of the EEG activity induced by the anaesthetic drugs. The different
approaches covered a wide range of quantification methods of stochastic processes,
from linear techniques in the spectral domain to non-linear techniques such as entropy
measurements. In Table 24.2 are shown a list of different methods applied to the EEG
signals under anaesthesia.
Despite several studies have indicated that the EEG exhibit some non-linear or
chaotic behaviour under anaesthesia and physiological sleep stages [1, 12, 43, 58],
still, non-linear analysis method applied to the DoA such as entropy, Hurst exponent,
fractal analysis among others, have shown significant enhancement in performance
respect the linear based methods. Similarly, to the research approaches, the dominant
techniques implemented in the current commercial systems in clinical daily use
3 and
with more extensive validation studies, are based on linear theory. In that respect,
while BIS, qCON and PSI indices are based on linear methods (Bispectrum and
Fourier Transform, respectively) the unique non-linear method commercially applied
is the spectral entropy in the SE module, with comparable results [35], and with small
differences attributable mostly to the systems artefact management [2, 42].
3 Main commercial DoA indices: The Bispectral index (BIS) T M (Medtronic, USA), the index of
hypnosis/sedation (qCON) c
(Fresenius Kabi, GmbH, Germany), (PSI) SEDLine T M (Masimo,
Irvine CA, USA), and State Entropy index (SE) ® (Datex-Ohmeda, GE).