

374
P. Martínez-Vázquez et al.
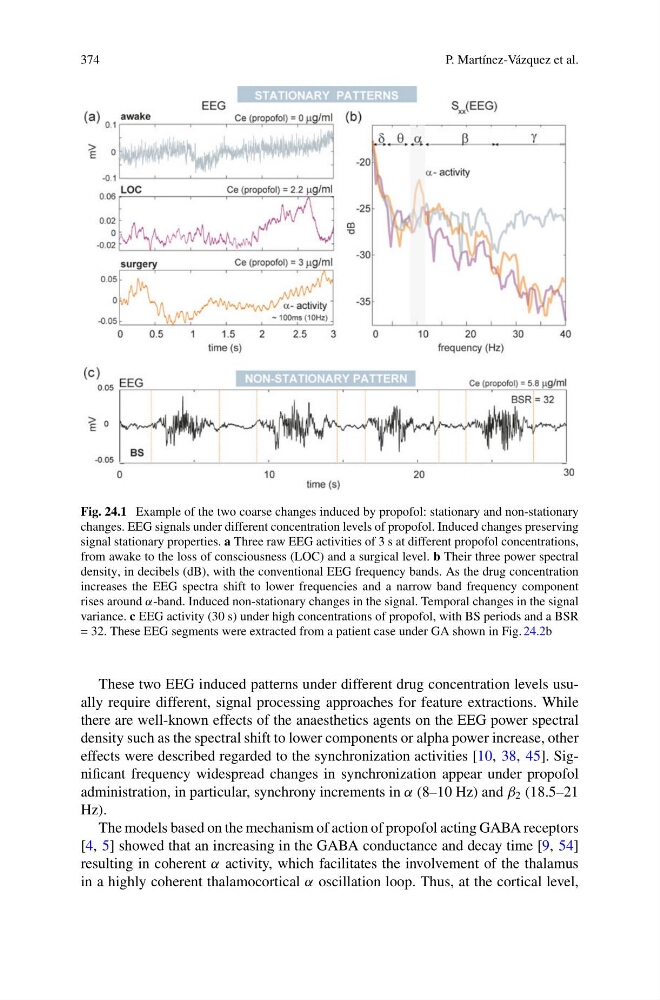
Fig. 24.1 Example of the two coarse changes induced by propofol: stationary and non-stationary
changes. EEG signals under different concentration levels of propofol. Induced changes preserving
signal stationary properties. a Three raw EEG activities of 3 s at different propofol concentrations,
from awake to the loss of consciousness (LOC) and a surgical level. b Their three power spectral
density, in decibels (dB), with the conventional EEG frequency bands. As the drug concentration
increases the EEG spectra shift to lower frequencies and a narrow band frequency component
rises around α-band. Induced non-stationary changes in the signal. Temporal changes in the signal
variance. c EEG activity (30 s) under high concentrations of propofol, with BS periods and a BSR
= 32. These EEG segments were extracted from a patient case under GA shown in Fig. 24.2b
These two EEG induced patterns under different drug concentration levels usually require different, signal processing approaches for feature extractions. While
there are well-known effects of the anaesthetics agents on the EEG power spectral
density such as the spectral shift to lower components or alpha power increase, other
effects were described regarded to the synchronization activities [10, 38, 45]. Significant frequency widespread changes in synchronization appear under propofol
administration, in particular, synchrony increments in α (8–10 Hz) and β 2 (18.5–21
Hz).
The models based on the mechanism of action of propofol acting GABA receptors
[4, 5] showed that an increasing in the GABA conductance and decay time [9, 54]
resulting in coherent α activity, which facilitates the involvement of the thalamus
in a highly coherent thalamocortical α oscillation loop. Thus, at the cortical level,
P. Martínez-Vázquez et al.
Fig. 24.1 Example of the two coarse changes induced by propofol: stationary and non-stationary
changes. EEG signals under different concentration levels of propofol. Induced changes preserving
signal stationary properties. a Three raw EEG activities of 3 s at different propofol concentrations,
from awake to the loss of consciousness (LOC) and a surgical level. b Their three power spectral
density, in decibels (dB), with the conventional EEG frequency bands. As the drug concentration
increases the EEG spectra shift to lower frequencies and a narrow band frequency component
rises around α-band. Induced non-stationary changes in the signal. Temporal changes in the signal
variance. c EEG activity (30 s) under high concentrations of propofol, with BS periods and a BSR
= 32. These EEG segments were extracted from a patient case under GA shown in Fig. 24.2b
These two EEG induced patterns under different drug concentration levels usually require different, signal processing approaches for feature extractions. While
there are well-known effects of the anaesthetics agents on the EEG power spectral
density such as the spectral shift to lower components or alpha power increase, other
effects were described regarded to the synchronization activities [10, 38, 45]. Significant frequency widespread changes in synchronization appear under propofol
administration, in particular, synchrony increments in α (8–10 Hz) and β 2 (18.5–21
Hz).
The models based on the mechanism of action of propofol acting GABA receptors
[4, 5] showed that an increasing in the GABA conductance and decay time [9, 54]
resulting in coherent α activity, which facilitates the involvement of the thalamus
in a highly coherent thalamocortical α oscillation loop. Thus, at the cortical level,