

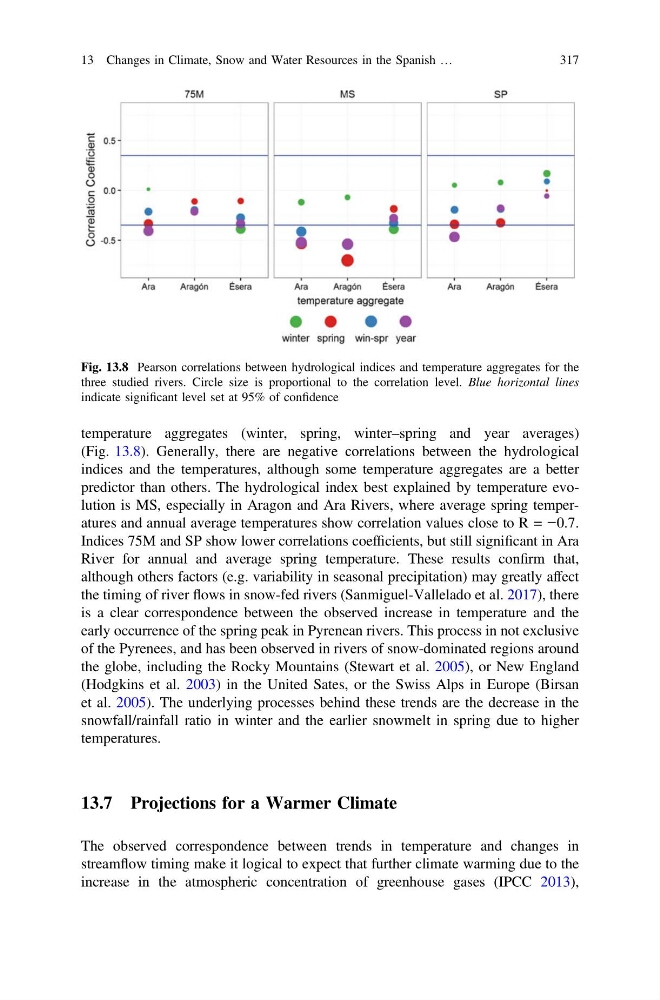
temperature aggregates (winter, spring, winter–spring and year averages)
(Fig. 13.8). Generally, there are negative correlations between the hydrological
indices and the temperatures, although some temperature aggregates are a better
predictor than others. The hydrological index best explained by temperature evolution is MS, especially in Aragon and Ara Rivers, where average spring temperatures and annual average temperatures show correlation values close to R = −0.7.
Indices 75M and SP show lower correlations coefficients, but still significant in Ara
River for annual and average spring temperature. These results confirm that,
although others factors (e.g. variability in seasonal precipitation) may greatly affect
the timing of river flows in snow-fed rivers (Sanmiguel-Vallelado et al. 2017), there
is a clear correspondence between the observed increase in temperature and the
early occurrence of the spring peak in Pyrenean rivers. This process in not exclusive
of the Pyrenees, and has been observed in rivers of snow-dominated regions around
the globe, including the Rocky Mountains (Stewart et al. 2005), or New England
(Hodgkins et al. 2003) in the United Sates, or the Swiss Alps in Europe (Birsan
et al. 2005). The underlying processes behind these trends are the decrease in the
snowfall/rainfall ratio in winter and the earlier snowmelt in spring due to higher
temperatures.
13.7 Projections for a Warmer Climate
The observed correspondence between trends in temperature and changes in
streamflow timing make it logical to expect that further climate warming due to the
increase in the atmospheric concentration of greenhouse gases (IPCC 2013),
Fig. 13.8 Pearson correlations between hydrological indices and temperature aggregates for the
three studied rivers. Circle size is proportional to the correlation level. Blue horizontal lines
indicate significant level set at 95% of confidence
13 Changes in Climate, Snow and Water Resources in the Spanish …
317
(Fig. 13.8). Generally, there are negative correlations between the hydrological
indices and the temperatures, although some temperature aggregates are a better
predictor than others. The hydrological index best explained by temperature evolution is MS, especially in Aragon and Ara Rivers, where average spring temperatures and annual average temperatures show correlation values close to R = −0.7.
Indices 75M and SP show lower correlations coefficients, but still significant in Ara
River for annual and average spring temperature. These results confirm that,
although others factors (e.g. variability in seasonal precipitation) may greatly affect
the timing of river flows in snow-fed rivers (Sanmiguel-Vallelado et al. 2017), there
is a clear correspondence between the observed increase in temperature and the
early occurrence of the spring peak in Pyrenean rivers. This process in not exclusive
of the Pyrenees, and has been observed in rivers of snow-dominated regions around
the globe, including the Rocky Mountains (Stewart et al. 2005), or New England
(Hodgkins et al. 2003) in the United Sates, or the Swiss Alps in Europe (Birsan
et al. 2005). The underlying processes behind these trends are the decrease in the
snowfall/rainfall ratio in winter and the earlier snowmelt in spring due to higher
temperatures.
13.7 Projections for a Warmer Climate
The observed correspondence between trends in temperature and changes in
streamflow timing make it logical to expect that further climate warming due to the
increase in the atmospheric concentration of greenhouse gases (IPCC 2013),
Fig. 13.8 Pearson correlations between hydrological indices and temperature aggregates for the
three studied rivers. Circle size is proportional to the correlation level. Blue horizontal lines
indicate significant level set at 95% of confidence
13 Changes in Climate, Snow and Water Resources in the Spanish …
317