

rivers, although trends for SP are not significant with a 95% confidence level.
Trends in the other two indices are statistically significant: the day when maximum
spring flows are reached occurs now a month earlier and the day when the 75th
percentile of the yearly streamflow is reached occurs nearly 20 days earlier.
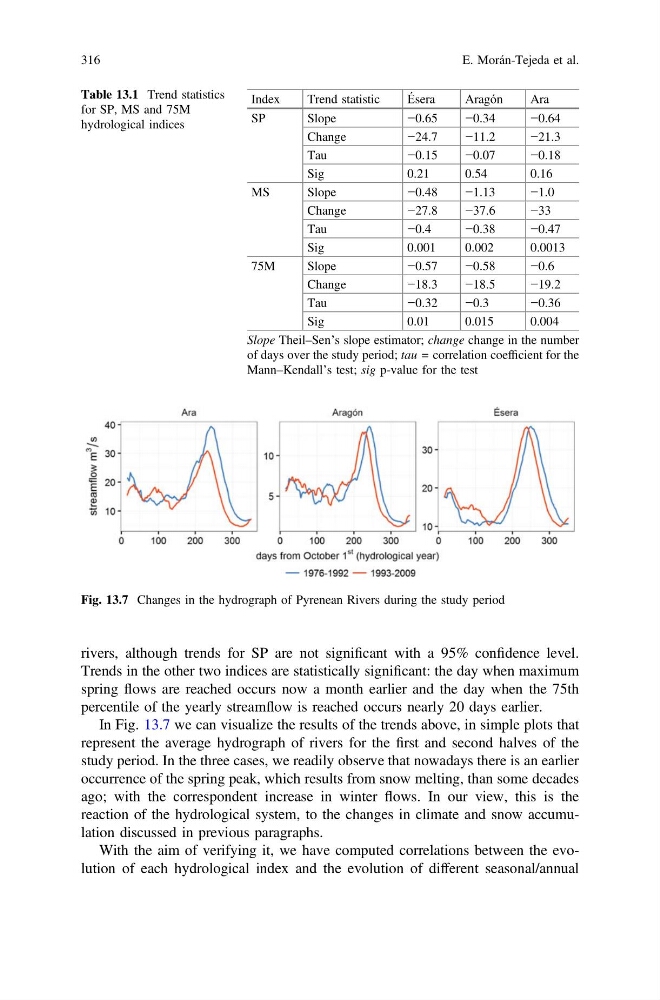
In Fig. 13.7 we can visualize the results of the trends above, in simple plots that
represent the average hydrograph of rivers for the first and second halves of the
study period. In the three cases, we readily observe that nowadays there is an earlier
occurrence of the spring peak, which results from snow melting, than some decades
ago; with the correspondent increase in winter flows. In our view, this is the
reaction of the hydrological system, to the changes in climate and snow accumulation discussed in previous paragraphs.
With the aim of verifying it, we have computed correlations between the evolution of each hydrological index and the evolution of different seasonal/annual
Table 13.1 Trend statistics
for SP, MS and 75M
hydrological indices
Index
Trend statistic
Ésera
Aragón
Ara
SP
Slope
−0.65
−0.34
−0.64
Change
−24.7
−11.2
−21.3
Tau
−0.15
−0.07
−0.18
Sig
0.21
0.54
0.16
MS
Slope
−0.48
−1.13
−1.0
Change
−27.8
−37.6
−33
Tau
−0.4
−0.38
−0.47
Sig
0.001
0.002
0.0013
75M
Slope
−0.57
−0.58
−0.6
Change
−18.3
−18.5
−19.2
Tau
−0.32
−0.3
−0.36
Sig
0.01
0.015
0.004
Slope Theil–Sen’s slope estimator; change change in the number
of days over the study period; tau = correlation coefficient for the
Mann–Kendall’s test; sig p-value for the test
Fig. 13.7 Changes in the hydrograph of Pyrenean Rivers during the study period
316
E. Morán-Tejeda et al.
Trends in the other two indices are statistically significant: the day when maximum
spring flows are reached occurs now a month earlier and the day when the 75th
percentile of the yearly streamflow is reached occurs nearly 20 days earlier.
In Fig. 13.7 we can visualize the results of the trends above, in simple plots that
represent the average hydrograph of rivers for the first and second halves of the
study period. In the three cases, we readily observe that nowadays there is an earlier
occurrence of the spring peak, which results from snow melting, than some decades
ago; with the correspondent increase in winter flows. In our view, this is the
reaction of the hydrological system, to the changes in climate and snow accumulation discussed in previous paragraphs.
With the aim of verifying it, we have computed correlations between the evolution of each hydrological index and the evolution of different seasonal/annual
Table 13.1 Trend statistics
for SP, MS and 75M
hydrological indices
Index
Trend statistic
Ésera
Aragón
Ara
SP
Slope
−0.65
−0.34
−0.64
Change
−24.7
−11.2
−21.3
Tau
−0.15
−0.07
−0.18
Sig
0.21
0.54
0.16
MS
Slope
−0.48
−1.13
−1.0
Change
−27.8
−37.6
−33
Tau
−0.4
−0.38
−0.47
Sig
0.001
0.002
0.0013
75M
Slope
−0.57
−0.58
−0.6
Change
−18.3
−18.5
−19.2
Tau
−0.32
−0.3
−0.36
Sig
0.01
0.015
0.004
Slope Theil–Sen’s slope estimator; change change in the number
of days over the study period; tau = correlation coefficient for the
Mann–Kendall’s test; sig p-value for the test
Fig. 13.7 Changes in the hydrograph of Pyrenean Rivers during the study period
316
E. Morán-Tejeda et al.