

was addressed in the Global Observation Research Initiative in Alpine
Environments (GLORIA, http://www.gloria.ac.at), which provides a detailed protocol to record summit vegetation (Grabherr et al. 2000). Within less than a decade,
significant changes in vegetation were already found in monitoring sites across
Europe that were set up in 2001 and repeated in 2008 (Pauli et al. 2012; Gottfried
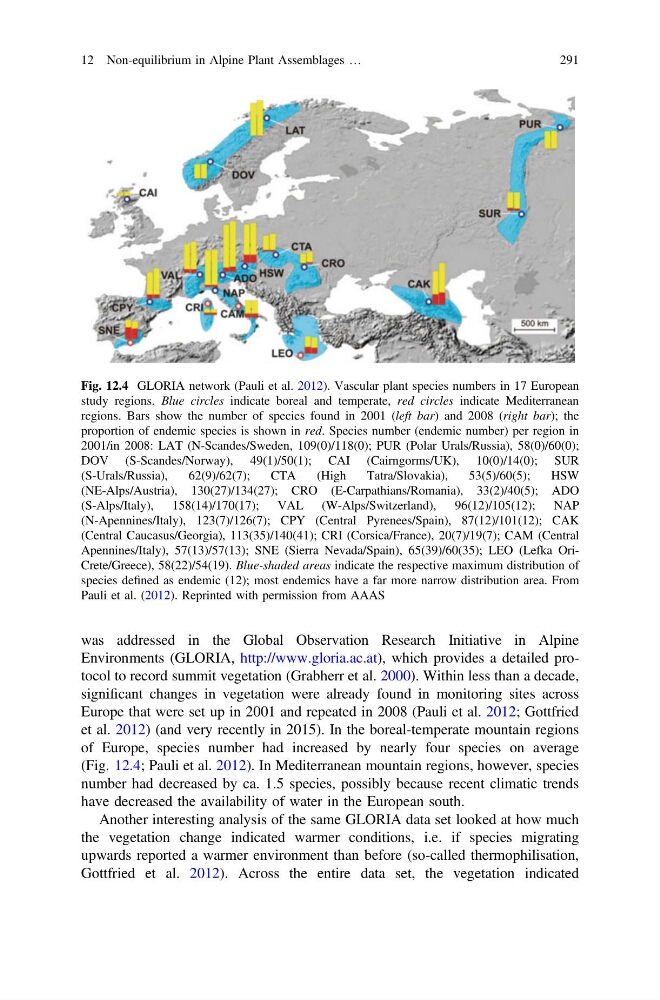
et al. 2012) (and very recently in 2015). In the boreal-temperate mountain regions
of Europe, species number had increased by nearly four species on average
(Fig. 12.4; Pauli et al. 2012). In Mediterranean mountain regions, however, species
number had decreased by ca. 1.5 species, possibly because recent climatic trends
have decreased the availability of water in the European south.
Another interesting analysis of the same GLORIA data set looked at how much
the vegetation change indicated warmer conditions, i.e. if species migrating
upwards reported a warmer environment than before (so-called thermophilisation,
Gottfried et al. 2012). Across the entire data set, the vegetation indicated
Fig. 12.4 GLORIA network (Pauli et al. 2012). Vascular plant species numbers in 17 European
study regions. Blue circles indicate boreal and temperate, red circles indicate Mediterranean
regions. Bars show the number of species found in 2001 (left bar) and 2008 (right bar); the
proportion of endemic species is shown in red. Species number (endemic number) per region in
2001/in 2008: LAT (N-Scandes/Sweden, 109(0)/118(0); PUR (Polar Urals/Russia), 58(0)/60(0);
DOV (S-Scandes/Norway), 49(1)/50(1); CAI (Cairngorms/UK), 10(0)/14(0); SUR
(S-Urals/Russia),
62(9)/62(7);
CTA
(High
Tatra/Slovakia),
53(5)/60(5);
HSW
(NE-Alps/Austria), 130(27)/134(27); CRO (E-Carpathians/Romania), 33(2)/40(5); ADO
(S-Alps/Italy), 158(14)/170(17); VAL (W-Alps/Switzerland), 96(12)/105(12); NAP
(N-Apennines/Italy), 123(7)/126(7); CPY (Central Pyrenees/Spain), 87(12)/101(12); CAK
(Central Caucasus/Georgia), 113(35)/140(41); CRI (Corsica/France), 20(7)/19(7); CAM (Central
Apennines/Italy), 57(13)/57(13); SNE (Sierra Nevada/Spain), 65(39)/60(35); LEO (Lefka OriCrete/Greece), 58(22)/54(19). Blue-shaded areas indicate the respective maximum distribution of
species defined as endemic (12); most endemics have a far more narrow distribution area. From
Pauli et al. (2012). Reprinted with permission from AAAS
12 Non-equilibrium in Alpine Plant Assemblages …
291
Environments (GLORIA, http://www.gloria.ac.at), which provides a detailed protocol to record summit vegetation (Grabherr et al. 2000). Within less than a decade,
significant changes in vegetation were already found in monitoring sites across
Europe that were set up in 2001 and repeated in 2008 (Pauli et al. 2012; Gottfried
et al. 2012) (and very recently in 2015). In the boreal-temperate mountain regions
of Europe, species number had increased by nearly four species on average
(Fig. 12.4; Pauli et al. 2012). In Mediterranean mountain regions, however, species
number had decreased by ca. 1.5 species, possibly because recent climatic trends
have decreased the availability of water in the European south.
Another interesting analysis of the same GLORIA data set looked at how much
the vegetation change indicated warmer conditions, i.e. if species migrating
upwards reported a warmer environment than before (so-called thermophilisation,
Gottfried et al. 2012). Across the entire data set, the vegetation indicated
Fig. 12.4 GLORIA network (Pauli et al. 2012). Vascular plant species numbers in 17 European
study regions. Blue circles indicate boreal and temperate, red circles indicate Mediterranean
regions. Bars show the number of species found in 2001 (left bar) and 2008 (right bar); the
proportion of endemic species is shown in red. Species number (endemic number) per region in
2001/in 2008: LAT (N-Scandes/Sweden, 109(0)/118(0); PUR (Polar Urals/Russia), 58(0)/60(0);
DOV (S-Scandes/Norway), 49(1)/50(1); CAI (Cairngorms/UK), 10(0)/14(0); SUR
(S-Urals/Russia),
62(9)/62(7);
CTA
(High
Tatra/Slovakia),
53(5)/60(5);
HSW
(NE-Alps/Austria), 130(27)/134(27); CRO (E-Carpathians/Romania), 33(2)/40(5); ADO
(S-Alps/Italy), 158(14)/170(17); VAL (W-Alps/Switzerland), 96(12)/105(12); NAP
(N-Apennines/Italy), 123(7)/126(7); CPY (Central Pyrenees/Spain), 87(12)/101(12); CAK
(Central Caucasus/Georgia), 113(35)/140(41); CRI (Corsica/France), 20(7)/19(7); CAM (Central
Apennines/Italy), 57(13)/57(13); SNE (Sierra Nevada/Spain), 65(39)/60(35); LEO (Lefka OriCrete/Greece), 58(22)/54(19). Blue-shaded areas indicate the respective maximum distribution of
species defined as endemic (12); most endemics have a far more narrow distribution area. From
Pauli et al. (2012). Reprinted with permission from AAAS
12 Non-equilibrium in Alpine Plant Assemblages …
291