

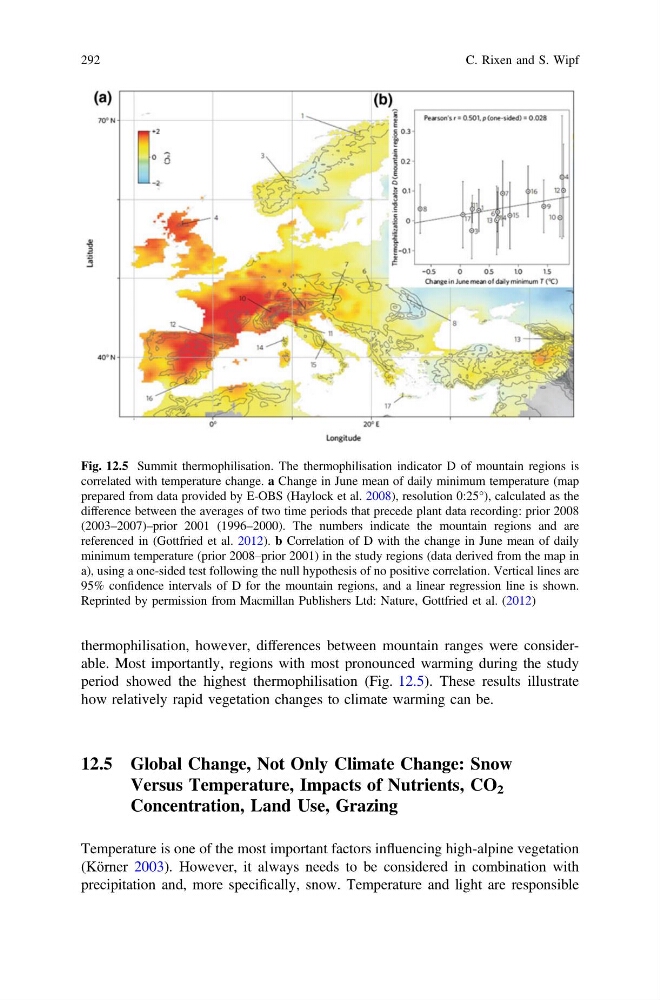
thermophilisation, however, differences between mountain ranges were considerable. Most importantly, regions with most pronounced warming during the study
period showed the highest thermophilisation (Fig. 12.5). These results illustrate
how relatively rapid vegetation changes to climate warming can be.
12.5 Global Change, Not Only Climate Change: Snow
Versus Temperature, Impacts of Nutrients, CO 2
Concentration, Land Use, Grazing
Temperature is one of the most important factors influencing high-alpine vegetation
(Körner 2003). However, it always needs to be considered in combination with
precipitation and, more specifically, snow. Temperature and light are responsible
Fig. 12.5 Summit thermophilisation. The thermophilisation indicator D of mountain regions is
correlated with temperature change. a Change in June mean of daily minimum temperature (map
prepared from data provided by E-OBS (Haylock et al. 2008), resolution 0:25°), calculated as the
difference between the averages of two time periods that precede plant data recording: prior 2008
(2003–2007)–prior 2001 (1996–2000). The numbers indicate the mountain regions and are
referenced in (Gottfried et al. 2012). b Correlation of D with the change in June mean of daily
minimum temperature (prior 2008–prior 2001) in the study regions (data derived from the map in
a), using a one-sided test following the null hypothesis of no positive correlation. Vertical lines are
95% confidence intervals of D for the mountain regions, and a linear regression line is shown.
Reprinted by permission from Macmillan Publishers Ltd: Nature, Gottfried et al. (2012)
292
C. Rixen and S. Wipf
period showed the highest thermophilisation (Fig. 12.5). These results illustrate
how relatively rapid vegetation changes to climate warming can be.
12.5 Global Change, Not Only Climate Change: Snow
Versus Temperature, Impacts of Nutrients, CO 2
Concentration, Land Use, Grazing
Temperature is one of the most important factors influencing high-alpine vegetation
(Körner 2003). However, it always needs to be considered in combination with
precipitation and, more specifically, snow. Temperature and light are responsible
Fig. 12.5 Summit thermophilisation. The thermophilisation indicator D of mountain regions is
correlated with temperature change. a Change in June mean of daily minimum temperature (map
prepared from data provided by E-OBS (Haylock et al. 2008), resolution 0:25°), calculated as the
difference between the averages of two time periods that precede plant data recording: prior 2008
(2003–2007)–prior 2001 (1996–2000). The numbers indicate the mountain regions and are
referenced in (Gottfried et al. 2012). b Correlation of D with the change in June mean of daily
minimum temperature (prior 2008–prior 2001) in the study regions (data derived from the map in
a), using a one-sided test following the null hypothesis of no positive correlation. Vertical lines are
95% confidence intervals of D for the mountain regions, and a linear regression line is shown.
Reprinted by permission from Macmillan Publishers Ltd: Nature, Gottfried et al. (2012)
292
C. Rixen and S. Wipf