

dispersion. Additional studies exploring the mechanisms that generate this pattern,
the interbiome and empirical variability of the z values mentioned above, the
variations with taxonomic resolution (Horner-Devine et al. 2004) and the limits and
spatial scaling, are topics that microbial ecologists may be interested in developing
further and high mountain lakes offer a very convenient natural scenario to explore
it. If microorganisms are globally dispersed and cosmopolitan, the OTUs locally
present in Pyrenean lakes will represent a large fraction of the cumulative species
pool present in high mountain lakes around the world. Because of the high similarity of this type of environment across continents, this is a hypothesis that can be
reasonably well tested.
The quantification of community similarity based on phylogenetic relatedness
also provides new perspectives to bridge the gap between evolutionary and ecological analyses (Barberán et al. 2014a). Patterns capturing how phylogenetic
community similarity is distributed along environmental gradients emerge without
relying on any particular operational taxonomic unit definition (Barberán and
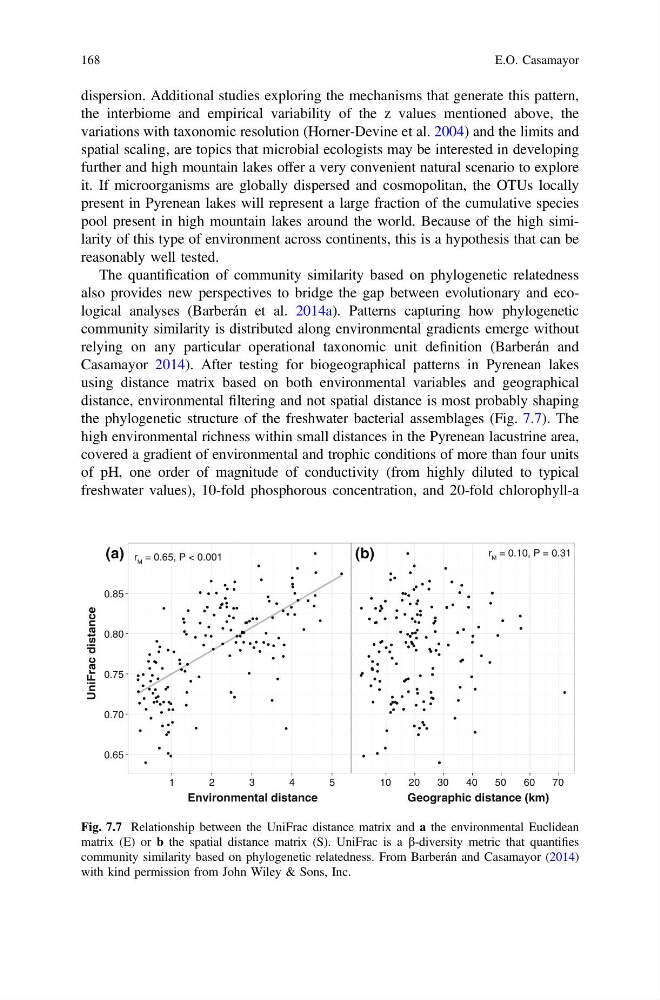
Casamayor 2014). After testing for biogeographical patterns in Pyrenean lakes
using distance matrix based on both environmental variables and geographical
distance, environmental filtering and not spatial distance is most probably shaping
the phylogenetic structure of the freshwater bacterial assemblages (Fig. 7.7). The
high environmental richness within small distances in the Pyrenean lacustrine area,
covered a gradient of environmental and trophic conditions of more than four units
of pH, one order of magnitude of conductivity (from highly diluted to typical
freshwater values), 10-fold phosphorous concentration, and 20-fold chlorophyll-a
Environmental distance
UniFrac distance
0.65
0.70
0.75
0.80
0.85
1
2
3
4
5
r M = 0.65, P < 0.001
Geographic distance (km)
10
20
30
40
50
60
70
r M = 0.10, P = 0.31
(a)
(b)
Fig. 7.7 Relationship between the UniFrac distance matrix and a the environmental Euclidean
matrix (E) or b the spatial distance matrix (S). UniFrac is a b-diversity metric that quantifies
community similarity based on phylogenetic relatedness. From Barberán and Casamayor (2014)
with kind permission from John Wiley & Sons, Inc.
168
E.O. Casamayor
the interbiome and empirical variability of the z values mentioned above, the
variations with taxonomic resolution (Horner-Devine et al. 2004) and the limits and
spatial scaling, are topics that microbial ecologists may be interested in developing
further and high mountain lakes offer a very convenient natural scenario to explore
it. If microorganisms are globally dispersed and cosmopolitan, the OTUs locally
present in Pyrenean lakes will represent a large fraction of the cumulative species
pool present in high mountain lakes around the world. Because of the high similarity of this type of environment across continents, this is a hypothesis that can be
reasonably well tested.
The quantification of community similarity based on phylogenetic relatedness
also provides new perspectives to bridge the gap between evolutionary and ecological analyses (Barberán et al. 2014a). Patterns capturing how phylogenetic
community similarity is distributed along environmental gradients emerge without
relying on any particular operational taxonomic unit definition (Barberán and
Casamayor 2014). After testing for biogeographical patterns in Pyrenean lakes
using distance matrix based on both environmental variables and geographical
distance, environmental filtering and not spatial distance is most probably shaping
the phylogenetic structure of the freshwater bacterial assemblages (Fig. 7.7). The
high environmental richness within small distances in the Pyrenean lacustrine area,
covered a gradient of environmental and trophic conditions of more than four units
of pH, one order of magnitude of conductivity (from highly diluted to typical
freshwater values), 10-fold phosphorous concentration, and 20-fold chlorophyll-a
Environmental distance
UniFrac distance
0.65
0.70
0.75
0.80
0.85
1
2
3
4
5
r M = 0.65, P < 0.001
Geographic distance (km)
10
20
30
40
50
60
70
r M = 0.10, P = 0.31
(a)
(b)
Fig. 7.7 Relationship between the UniFrac distance matrix and a the environmental Euclidean
matrix (E) or b the spatial distance matrix (S). UniFrac is a b-diversity metric that quantifies
community similarity based on phylogenetic relatedness. From Barberán and Casamayor (2014)
with kind permission from John Wiley & Sons, Inc.
168
E.O. Casamayor