

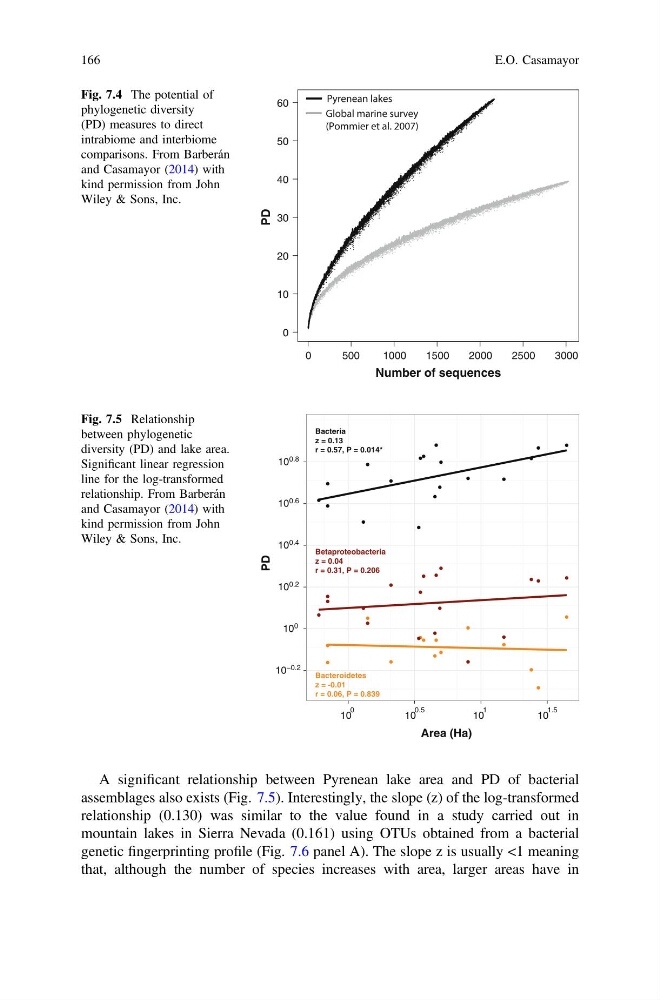
A significant relationship between Pyrenean lake area and PD of bacterial
assemblages also exists (Fig. 7.5). Interestingly, the slope (z) of the log-transformed
relationship (0.130) was similar to the value found in a study carried out in
mountain lakes in Sierra Nevada (0.161) using OTUs obtained from a bacterial
genetic fingerprinting profile (Fig. 7.6 panel A). The slope z is usually <1 meaning
that, although the number of species increases with area, larger areas have in
0
500
1000
1500
2000
2500
3000
0
10
20
30
40
50
60
Number of sequences
PD
Fig. 7.4 The potential of
phylogenetic diversity
(PD) measures to direct
intrabiome and interbiome
comparisons. From Barberán
and Casamayor (2014) with
kind permission from John
Wiley & Sons, Inc.
Area (Ha)
PD
10
−0.2
10
0
10
0.2
10
0.4
10
0.6
10
0.8
10
0
10
0.5
10
1
10
1.5
Bacteria
z = 0.13
r = 0.57, P = 0.014*
Betaproteobacteria
z = 0.04
r = 0.31, P = 0.206
Bacteroidetes
z = -0.01
r = 0.06, P = 0.839
Fig. 7.5 Relationship
between phylogenetic
diversity (PD) and lake area.
Significant linear regression
line for the log-transformed
relationship. From Barberán
and Casamayor (2014) with
kind permission from John
Wiley & Sons, Inc.
166
E.O. Casamayor
assemblages also exists (Fig. 7.5). Interestingly, the slope (z) of the log-transformed
relationship (0.130) was similar to the value found in a study carried out in
mountain lakes in Sierra Nevada (0.161) using OTUs obtained from a bacterial
genetic fingerprinting profile (Fig. 7.6 panel A). The slope z is usually <1 meaning
that, although the number of species increases with area, larger areas have in
0
500
1000
1500
2000
2500
3000
0
10
20
30
40
50
60
Number of sequences
PD
Fig. 7.4 The potential of
phylogenetic diversity
(PD) measures to direct
intrabiome and interbiome
comparisons. From Barberán
and Casamayor (2014) with
kind permission from John
Wiley & Sons, Inc.
Area (Ha)
PD
10
−0.2
10
0
10
0.2
10
0.4
10
0.6
10
0.8
10
0
10
0.5
10
1
10
1.5
Bacteria
z = 0.13
r = 0.57, P = 0.014*
Betaproteobacteria
z = 0.04
r = 0.31, P = 0.206
Bacteroidetes
z = -0.01
r = 0.06, P = 0.839
Fig. 7.5 Relationship
between phylogenetic
diversity (PD) and lake area.
Significant linear regression
line for the log-transformed
relationship. From Barberán
and Casamayor (2014) with
kind permission from John
Wiley & Sons, Inc.
166
E.O. Casamayor