

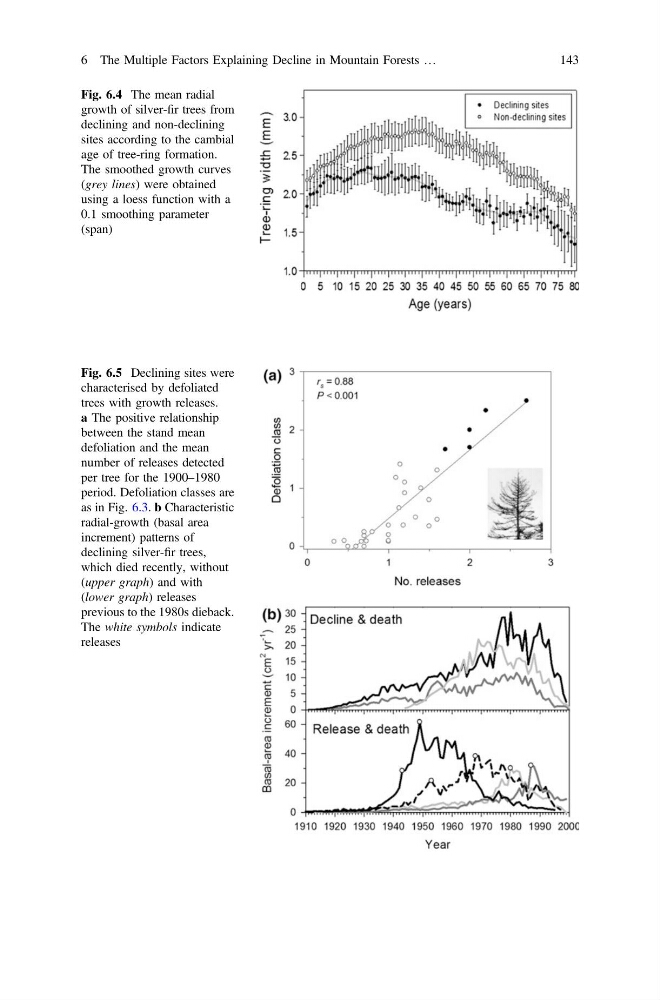
Fig. 6.4 The mean radial
growth of silver-fir trees from
declining and non-declining
sites according to the cambial
age of tree-ring formation.
The smoothed growth curves
(grey lines) were obtained
using a loess function with a
0.1 smoothing parameter
(span)
Fig. 6.5 Declining sites were
characterised by defoliated
trees with growth releases.
a The positive relationship
between the stand mean
defoliation and the mean
number of releases detected
per tree for the 1900–1980
period. Defoliation classes are
as in Fig. 6.3. b Characteristic
radial-growth (basal area
increment) patterns of
declining silver-fir trees,
which died recently, without
(upper graph) and with
(lower graph) releases
previous to the 1980s dieback.
The white symbols indicate
releases
6 The Multiple Factors Explaining Decline in Mountain Forests …
143
growth of silver-fir trees from
declining and non-declining
sites according to the cambial
age of tree-ring formation.
The smoothed growth curves
(grey lines) were obtained
using a loess function with a
0.1 smoothing parameter
(span)
Fig. 6.5 Declining sites were
characterised by defoliated
trees with growth releases.
a The positive relationship
between the stand mean
defoliation and the mean
number of releases detected
per tree for the 1900–1980
period. Defoliation classes are
as in Fig. 6.3. b Characteristic
radial-growth (basal area
increment) patterns of
declining silver-fir trees,
which died recently, without
(upper graph) and with
(lower graph) releases
previous to the 1980s dieback.
The white symbols indicate
releases
6 The Multiple Factors Explaining Decline in Mountain Forests …
143