

5 Spintronics and Synchrotron Radiation
153
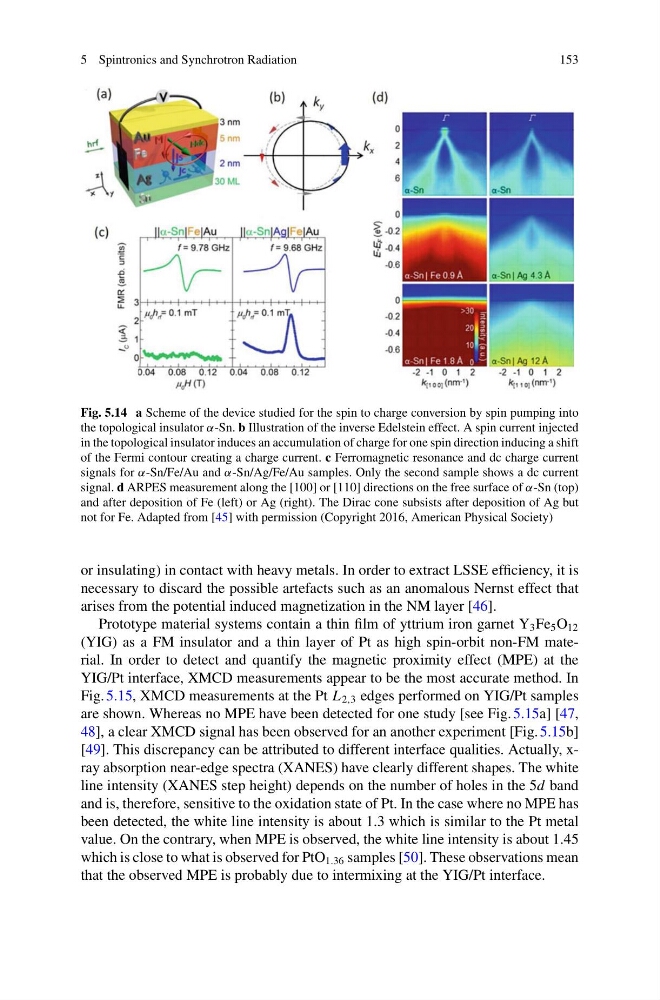
Fig. 5.14 a Scheme of the device studied for the spin to charge conversion by spin pumping into
the topological insulator α-Sn. b Illustration of the inverse Edelstein effect. A spin current injected
in the topological insulator induces an accumulation of charge for one spin direction inducing a shift
of the Fermi contour creating a charge current. c Ferromagnetic resonance and dc charge current
signals for α-Sn/Fe/Au and α-Sn/Ag/Fe/Au samples. Only the second sample shows a dc current
signal. d ARPES measurement along the [100] or [110] directions on the free surface of α-Sn (top)
and after deposition of Fe (left) or Ag (right). The Dirac cone subsists after deposition of Ag but
not for Fe. Adapted from [45] with permission (Copyright 2016, American Physical Society)
or insulating) in contact with heavy metals. In order to extract LSSE efficiency, it is
necessary to discard the possible artefacts such as an anomalous Nernst effect that
arises from the potential induced magnetization in the NM layer [46].
Prototype material systems contain a thin film of yttrium iron garnet Y 3 Fe 5 O 12
(YIG) as a FM insulator and a thin layer of Pt as high spin-orbit non-FM material. In order to detect and quantify the magnetic proximity effect (MPE) at the
YIG/Pt interface, XMCD measurements appear to be the most accurate method. In
Fig. 5.15, XMCD measurements at the Pt L 2,3 edges performed on YIG/Pt samples
are shown. Whereas no MPE have been detected for one study [see Fig. 5.15a] [47,
48], a clear XMCD signal has been observed for an another experiment [Fig. 5.15b]
[49]. This discrepancy can be attributed to different interface qualities. Actually, xray absorption near-edge spectra (XANES) have clearly different shapes. The white
line intensity (XANES step height) depends on the number of holes in the 5d band
and is, therefore, sensitive to the oxidation state of Pt. In the case where no MPE has
been detected, the white line intensity is about 1.3 which is similar to the Pt metal
value. On the contrary, when MPE is observed, the white line intensity is about 1.45
which is close to what is observed for PtO 1.36 samples [50]. These observations mean
that the observed MPE is probably due to intermixing at the YIG/Pt interface.
153
Fig. 5.14 a Scheme of the device studied for the spin to charge conversion by spin pumping into
the topological insulator α-Sn. b Illustration of the inverse Edelstein effect. A spin current injected
in the topological insulator induces an accumulation of charge for one spin direction inducing a shift
of the Fermi contour creating a charge current. c Ferromagnetic resonance and dc charge current
signals for α-Sn/Fe/Au and α-Sn/Ag/Fe/Au samples. Only the second sample shows a dc current
signal. d ARPES measurement along the [100] or [110] directions on the free surface of α-Sn (top)
and after deposition of Fe (left) or Ag (right). The Dirac cone subsists after deposition of Ag but
not for Fe. Adapted from [45] with permission (Copyright 2016, American Physical Society)
or insulating) in contact with heavy metals. In order to extract LSSE efficiency, it is
necessary to discard the possible artefacts such as an anomalous Nernst effect that
arises from the potential induced magnetization in the NM layer [46].
Prototype material systems contain a thin film of yttrium iron garnet Y 3 Fe 5 O 12
(YIG) as a FM insulator and a thin layer of Pt as high spin-orbit non-FM material. In order to detect and quantify the magnetic proximity effect (MPE) at the
YIG/Pt interface, XMCD measurements appear to be the most accurate method. In
Fig. 5.15, XMCD measurements at the Pt L 2,3 edges performed on YIG/Pt samples
are shown. Whereas no MPE have been detected for one study [see Fig. 5.15a] [47,
48], a clear XMCD signal has been observed for an another experiment [Fig. 5.15b]
[49]. This discrepancy can be attributed to different interface qualities. Actually, xray absorption near-edge spectra (XANES) have clearly different shapes. The white
line intensity (XANES step height) depends on the number of holes in the 5d band
and is, therefore, sensitive to the oxidation state of Pt. In the case where no MPE has
been detected, the white line intensity is about 1.3 which is similar to the Pt metal
value. On the contrary, when MPE is observed, the white line intensity is about 1.45
which is close to what is observed for PtO 1.36 samples [50]. These observations mean
that the observed MPE is probably due to intermixing at the YIG/Pt interface.