

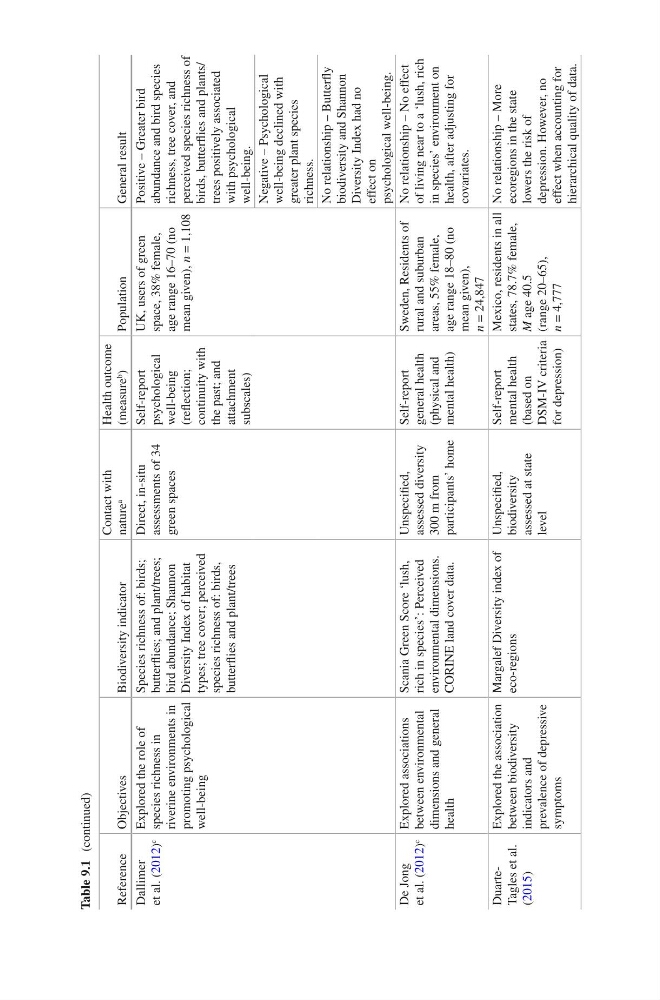
Table 9.1 (continued)
Reference
Objectives
Biodiversity indicator
Contact with
nature
a
Health outcome
(measure
b
)
Population
General result
Dallimer
et al. (2012)
c
Explored the role of
species richness in
riverine environments in
promoting psychological
well-being
Species richness of: birds;
butterflies; and plant/trees;
bird abundance; Shannon
Diversity Index of habitat
types; tree cover; perceived
species richness of: birds,
butterflies and plant/trees
Direct, in-situ
assessments of 34
green spaces
Self-report
psychological
well-being
(reflection;
continuity with
the past; and
attachment
subscales)
UK, users of green
space, 38% female,
age range 16–70 (no
mean given), n = 1,108
Positive – Greater bird
abundance and bird species
richness, tree cover, and
perceived species richness of
birds, butterflies and plants/
trees positively associated
with psychological
well-being.
Negative – Psychological
well- being declined with
greater plant species
richness.
No relationship – Butterfly
biodiversity and Shannon
Diversity Index had no
effect on
psychological well- being.
De Jong
et al. (2012)
c
Explored associations
between environmental
dimensions and general
health
Scania Green Score ‘lush,
rich in species’: Perceived
environmental dimensions.
CORINE land cover data.
Unspecified,
assessed diversity
300 m from
participants’ home
Self-report
general health
(physical and
mental health)
Sweden, Residents of
rural and suburban
areas, 55% female,
age range 18–80 (no
mean given),
n = 24,847
No relationship – No effect
of living near to a ‘lush, rich
in species’ environment on
health, after adjusting for
covariates.
DuarteTagles et al.
(2015)
Explored the association
between biodiversity
indicators and
prevalence of depressive
symptoms
Margalef Diversity index of
eco-regions
Unspecified,
biodiversity
assessed at state
level
Self-report
mental health
(based on
DSM-IV criteria
for depression)
Mexico, residents in all
states, 78.7% female,
M
age 40.5
(range 20–65),
n = 4,777
No relationship – More
ecoregions in the state
lowers the risk of
depression. However, no
effect when accounting for
hierarchical quality of data.
Reference
Objectives
Biodiversity indicator
Contact with
nature
a
Health outcome
(measure
b
)
Population
General result
Dallimer
et al. (2012)
c
Explored the role of
species richness in
riverine environments in
promoting psychological
well-being
Species richness of: birds;
butterflies; and plant/trees;
bird abundance; Shannon
Diversity Index of habitat
types; tree cover; perceived
species richness of: birds,
butterflies and plant/trees
Direct, in-situ
assessments of 34
green spaces
Self-report
psychological
well-being
(reflection;
continuity with
the past; and
attachment
subscales)
UK, users of green
space, 38% female,
age range 16–70 (no
mean given), n = 1,108
Positive – Greater bird
abundance and bird species
richness, tree cover, and
perceived species richness of
birds, butterflies and plants/
trees positively associated
with psychological
well-being.
Negative – Psychological
well- being declined with
greater plant species
richness.
No relationship – Butterfly
biodiversity and Shannon
Diversity Index had no
effect on
psychological well- being.
De Jong
et al. (2012)
c
Explored associations
between environmental
dimensions and general
health
Scania Green Score ‘lush,
rich in species’: Perceived
environmental dimensions.
CORINE land cover data.
Unspecified,
assessed diversity
300 m from
participants’ home
Self-report
general health
(physical and
mental health)
Sweden, Residents of
rural and suburban
areas, 55% female,
age range 18–80 (no
mean given),
n = 24,847
No relationship – No effect
of living near to a ‘lush, rich
in species’ environment on
health, after adjusting for
covariates.
DuarteTagles et al.
(2015)
Explored the association
between biodiversity
indicators and
prevalence of depressive
symptoms
Margalef Diversity index of
eco-regions
Unspecified,
biodiversity
assessed at state
level
Self-report
mental health
(based on
DSM-IV criteria
for depression)
Mexico, residents in all
states, 78.7% female,
M
age 40.5
(range 20–65),
n = 4,777
No relationship – More
ecoregions in the state
lowers the risk of
depression. However, no
effect when accounting for
hierarchical quality of data.