

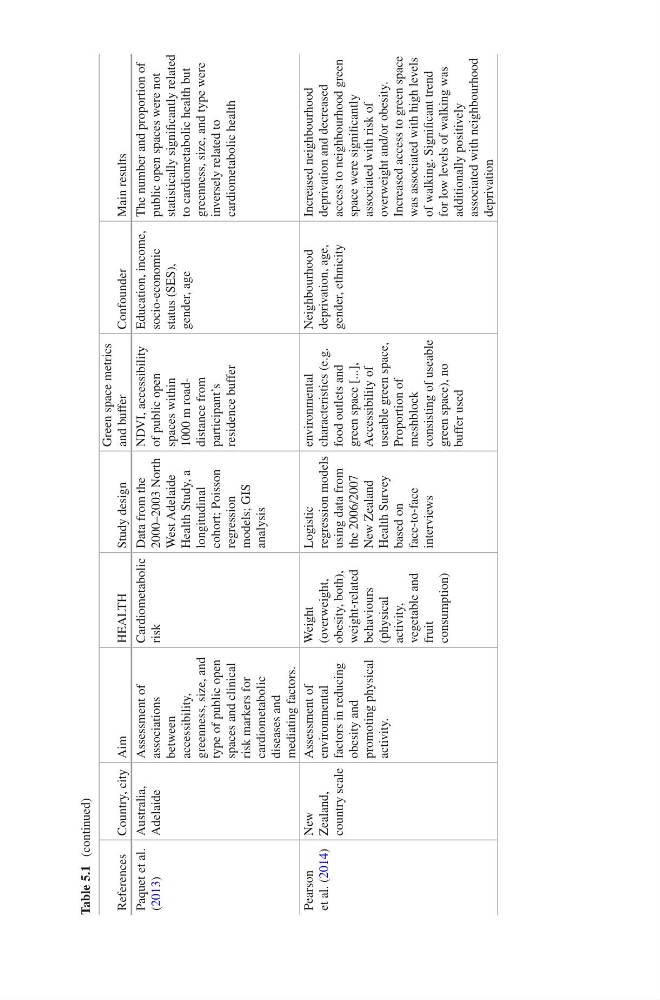
Table 5.1 (continued)
References Country, city Aim
HEALTH
Study design
Green space metrics
and buffer
Confounder
Main results
Paquet et al.
(2013)
Australia,
Adelaide
Assessment of
associations
between
accessibility,
greenness, size, and
type of public open
spaces and clinical
risk markers for
cardiometabolic
diseases and
mediating factors.
Cardiometabolic
risk
Data from the
2000–2003 North
West Adelaide
Health Study, a
longitudinal
cohort; Poisson
regression
models; GIS
analysis
NDVI, accessibility
of public open
spaces within
1000 m roaddistance from
participant’s
residence buffer
Education, income,
socio-economic
status (SES),
gender, age
The number and proportion of
public open spaces were not
statistically significantly related
to cardiometabolic health but
greenness, size, and type were
inversely related to
cardiometabolic health
Pearson
et al. (2014)
New
Zealand,
country scale
Assessment of
environmental
factors in reducing
obesity and
promoting physical
activity.
Weight
(overweight,
obesity, both),
weight-related
behaviours
(physical
activity,
vegetable and
fruit
consumption)
Logistic
regression models
using data from
the 2006/2007
New Zealand
Health Survey
based on
face-to-face
interviews
environmental
characteristics (e.g.
food outlets and
green space [...],
Accessibility of
useable green space,
Proportion of
meshblock
consisting of useable
green space), no
buffer used
Neighbourhood
deprivation, age,
gender, ethnicity
Increased neighbourhood
deprivation and decreased
access to neighbourhood green
space were significantly
associated with risk of
overweight and/or obesity.
Increased access to green space
was associated with high levels
of walking. Significant trend
for low levels of walking was
additionally positively
associated with neighbourhood
deprivation
References Country, city Aim
HEALTH
Study design
Green space metrics
and buffer
Confounder
Main results
Paquet et al.
(2013)
Australia,
Adelaide
Assessment of
associations
between
accessibility,
greenness, size, and
type of public open
spaces and clinical
risk markers for
cardiometabolic
diseases and
mediating factors.
Cardiometabolic
risk
Data from the
2000–2003 North
West Adelaide
Health Study, a
longitudinal
cohort; Poisson
regression
models; GIS
analysis
NDVI, accessibility
of public open
spaces within
1000 m roaddistance from
participant’s
residence buffer
Education, income,
socio-economic
status (SES),
gender, age
The number and proportion of
public open spaces were not
statistically significantly related
to cardiometabolic health but
greenness, size, and type were
inversely related to
cardiometabolic health
Pearson
et al. (2014)
New
Zealand,
country scale
Assessment of
environmental
factors in reducing
obesity and
promoting physical
activity.
Weight
(overweight,
obesity, both),
weight-related
behaviours
(physical
activity,
vegetable and
fruit
consumption)
Logistic
regression models
using data from
the 2006/2007
New Zealand
Health Survey
based on
face-to-face
interviews
environmental
characteristics (e.g.
food outlets and
green space [...],
Accessibility of
useable green space,
Proportion of
meshblock
consisting of useable
green space), no
buffer used
Neighbourhood
deprivation, age,
gender, ethnicity
Increased neighbourhood
deprivation and decreased
access to neighbourhood green
space were significantly
associated with risk of
overweight and/or obesity.
Increased access to green space
was associated with high levels
of walking. Significant trend
for low levels of walking was
additionally positively
associated with neighbourhood
deprivation