

568
Y. Luo et al.
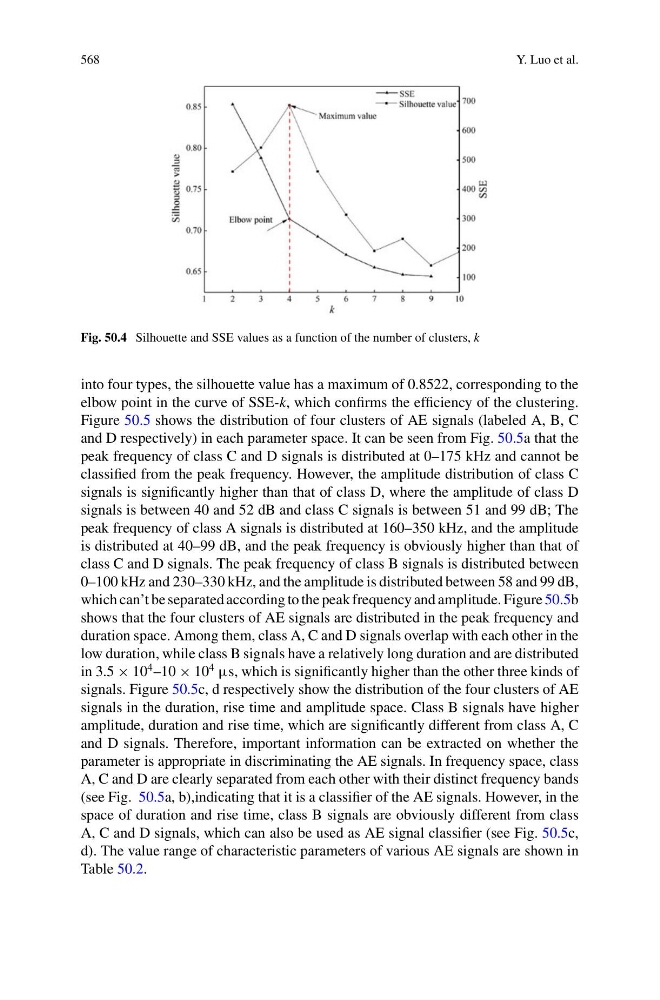
Fig. 50.4 Silhouette and SSE values as a function of the number of clusters, k
into four types, the silhouette value has a maximum of 0.8522, corresponding to the
elbow point in the curve of SSE-k, which confirms the efficiency of the clustering.
Figure 50.5 shows the distribution of four clusters of AE signals (labeled A, B, C
and D respectively) in each parameter space. It can be seen from Fig. 50.5a that the
peak frequency of class C and D signals is distributed at 0–175 kHz and cannot be
classified from the peak frequency. However, the amplitude distribution of class C
signals is significantly higher than that of class D, where the amplitude of class D
signals is between 40 and 52 dB and class C signals is between 51 and 99 dB; The
peak frequency of class A signals is distributed at 160–350 kHz, and the amplitude
is distributed at 40–99 dB, and the peak frequency is obviously higher than that of
class C and D signals. The peak frequency of class B signals is distributed between
0–100 kHz and 230–330 kHz, and the amplitude is distributed between 58 and 99 dB,
which can’t be separated according to the peak frequency and amplitude. Figure 50.5b
shows that the four clusters of AE signals are distributed in the peak frequency and
duration space. Among them, class A, C and D signals overlap with each other in the
low duration, while class B signals have a relatively long duration and are distributed
in 3.5 × 10
4 –10 × 10
4
μs, which is significantly higher than the other three kinds of
signals. Figure 50.5c, d respectively show the distribution of the four clusters of AE
signals in the duration, rise time and amplitude space. Class B signals have higher
amplitude, duration and rise time, which are significantly different from class A, C
and D signals. Therefore, important information can be extracted on whether the
parameter is appropriate in discriminating the AE signals. In frequency space, class
A, C and D are clearly separated from each other with their distinct frequency bands
(see Fig. 50.5a, b),indicating that it is a classifier of the AE signals. However, in the
space of duration and rise time, class B signals are obviously different from class
A, C and D signals, which can also be used as AE signal classifier (see Fig. 50.5c,
d). The value range of characteristic parameters of various AE signals are shown in
Table 50.2.
Y. Luo et al.
Fig. 50.4 Silhouette and SSE values as a function of the number of clusters, k
into four types, the silhouette value has a maximum of 0.8522, corresponding to the
elbow point in the curve of SSE-k, which confirms the efficiency of the clustering.
Figure 50.5 shows the distribution of four clusters of AE signals (labeled A, B, C
and D respectively) in each parameter space. It can be seen from Fig. 50.5a that the
peak frequency of class C and D signals is distributed at 0–175 kHz and cannot be
classified from the peak frequency. However, the amplitude distribution of class C
signals is significantly higher than that of class D, where the amplitude of class D
signals is between 40 and 52 dB and class C signals is between 51 and 99 dB; The
peak frequency of class A signals is distributed at 160–350 kHz, and the amplitude
is distributed at 40–99 dB, and the peak frequency is obviously higher than that of
class C and D signals. The peak frequency of class B signals is distributed between
0–100 kHz and 230–330 kHz, and the amplitude is distributed between 58 and 99 dB,
which can’t be separated according to the peak frequency and amplitude. Figure 50.5b
shows that the four clusters of AE signals are distributed in the peak frequency and
duration space. Among them, class A, C and D signals overlap with each other in the
low duration, while class B signals have a relatively long duration and are distributed
in 3.5 × 10
4 –10 × 10
4
μs, which is significantly higher than the other three kinds of
signals. Figure 50.5c, d respectively show the distribution of the four clusters of AE
signals in the duration, rise time and amplitude space. Class B signals have higher
amplitude, duration and rise time, which are significantly different from class A, C
and D signals. Therefore, important information can be extracted on whether the
parameter is appropriate in discriminating the AE signals. In frequency space, class
A, C and D are clearly separated from each other with their distinct frequency bands
(see Fig. 50.5a, b),indicating that it is a classifier of the AE signals. However, in the
space of duration and rise time, class B signals are obviously different from class
A, C and D signals, which can also be used as AE signal classifier (see Fig. 50.5c,
d). The value range of characteristic parameters of various AE signals are shown in
Table 50.2.