

50 Acoustic Emissions of Cathode Carbon Block …
567
according to (50.3). Then the cluster center is updated, and the mean value of all
objects in the cluster is taken as the new cluster center. Repeat the previous steps
until the cluster center does not change. Equations 50.2 and 50.3 are shown as follows
[19]:
d
2
i j (2) =
N
k=1
x
ik − x
jk
2
(50.2)
d
2
i j (2) =
N
k=1
x
ik − x
jk
2 → min
(50.3)
where x
ik and x
jk is the vector composed of the original and standardized parameters
of the AE signals.
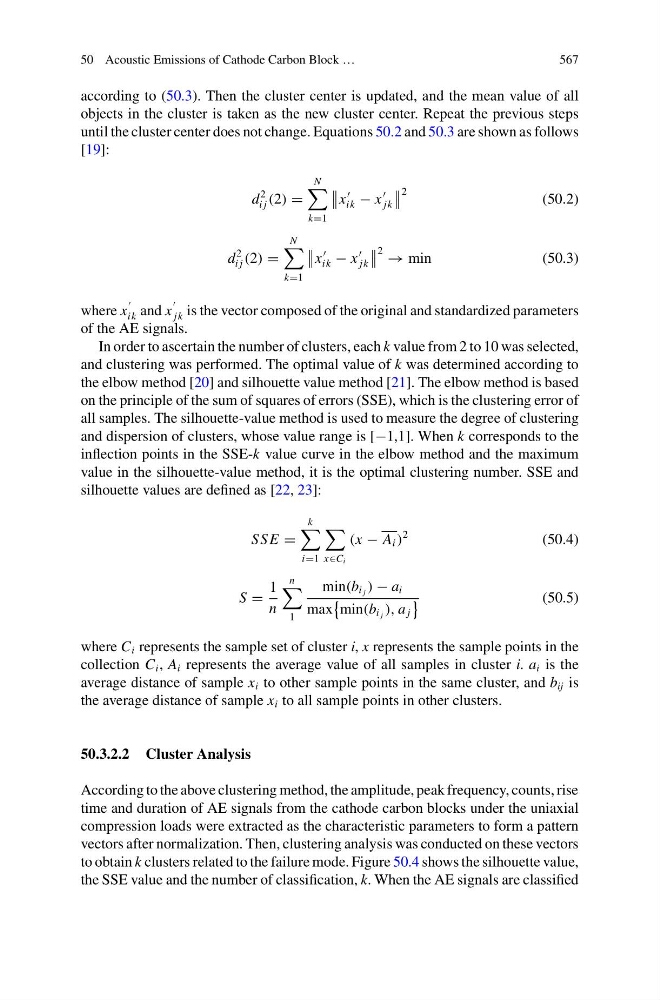
In order to ascertain the number of clusters, each k value from 2 to 10 was selected,
and clustering was performed. The optimal value of k was determined according to
the elbow method [20] and silhouette value method [21]. The elbow method is based
on the principle of the sum of squares of errors (SSE), which is the clustering error of
all samples. The silhouette-value method is used to measure the degree of clustering
and dispersion of clusters, whose value range is [−1,1]. When k corresponds to the
inflection points in the SSE-k value curve in the elbow method and the maximum
value in the silhouette-value method, it is the optimal clustering number. SSE and
silhouette values are defined as [22, 23]:
SS E =
k
i=1
x∈C i
(x − A i )
2
(50.4)
S =
1
n
n
1
min(b i j ) − a i
max
min(b i j ), a j
(50.5)
where C i represents the sample set of cluster i, x represents the sample points in the
collection C i , A i represents the average value of all samples in cluster i. a i is the
average distance of sample x i to other sample points in the same cluster, and b ij is
the average distance of sample x i to all sample points in other clusters.
50.3.2.2 Cluster Analysis
According to the above clustering method, the amplitude, peak frequency, counts, rise
time and duration of AE signals from the cathode carbon blocks under the uniaxial
compression loads were extracted as the characteristic parameters to form a pattern
vectors after normalization. Then, clustering analysis was conducted on these vectors
to obtain k clusters related to the failure mode. Figure 50.4 shows the silhouette value,
the SSE value and the number of classification, k. When the AE signals are classified
567
according to (50.3). Then the cluster center is updated, and the mean value of all
objects in the cluster is taken as the new cluster center. Repeat the previous steps
until the cluster center does not change. Equations 50.2 and 50.3 are shown as follows
[19]:
d
2
i j (2) =
N
k=1
x
ik − x
jk
2
(50.2)
d
2
i j (2) =
N
k=1
x
ik − x
jk
2 → min
(50.3)
where x
ik and x
jk is the vector composed of the original and standardized parameters
of the AE signals.
In order to ascertain the number of clusters, each k value from 2 to 10 was selected,
and clustering was performed. The optimal value of k was determined according to
the elbow method [20] and silhouette value method [21]. The elbow method is based
on the principle of the sum of squares of errors (SSE), which is the clustering error of
all samples. The silhouette-value method is used to measure the degree of clustering
and dispersion of clusters, whose value range is [−1,1]. When k corresponds to the
inflection points in the SSE-k value curve in the elbow method and the maximum
value in the silhouette-value method, it is the optimal clustering number. SSE and
silhouette values are defined as [22, 23]:
SS E =
k
i=1
x∈C i
(x − A i )
2
(50.4)
S =
1
n
n
1
min(b i j ) − a i
max
min(b i j ), a j
(50.5)
where C i represents the sample set of cluster i, x represents the sample points in the
collection C i , A i represents the average value of all samples in cluster i. a i is the
average distance of sample x i to other sample points in the same cluster, and b ij is
the average distance of sample x i to all sample points in other clusters.
50.3.2.2 Cluster Analysis
According to the above clustering method, the amplitude, peak frequency, counts, rise
time and duration of AE signals from the cathode carbon blocks under the uniaxial
compression loads were extracted as the characteristic parameters to form a pattern
vectors after normalization. Then, clustering analysis was conducted on these vectors
to obtain k clusters related to the failure mode. Figure 50.4 shows the silhouette value,
the SSE value and the number of classification, k. When the AE signals are classified