

498
X. Zeng et al.
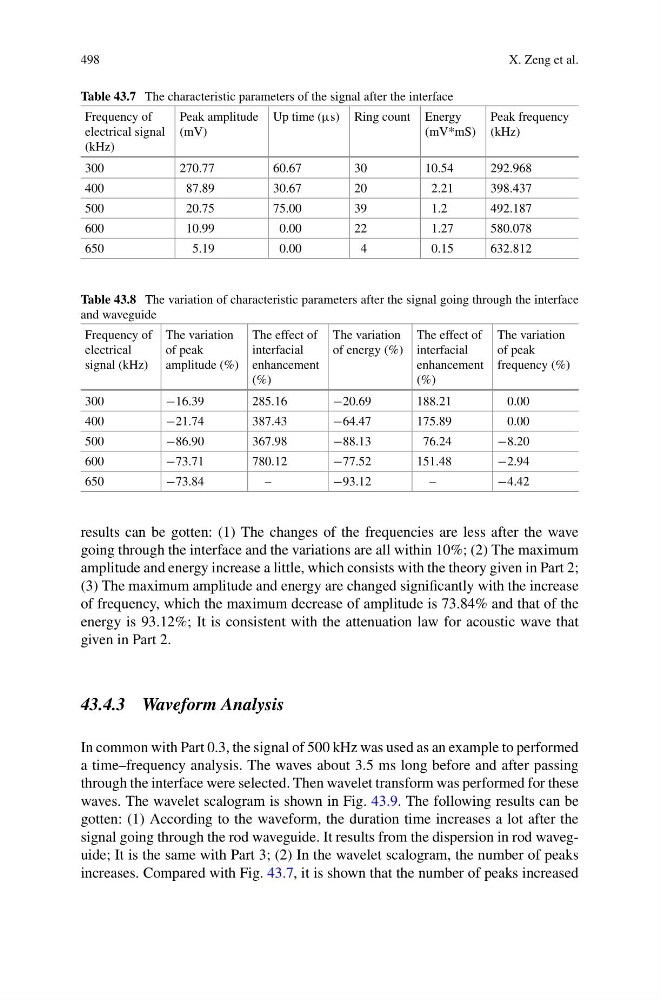
Table 43.7 The characteristic parameters of the signal after the interface
Frequency of
electrical signal
(kHz)
Peak amplitude
(mV)
Up time (µs) Ring count Energy
(mV*mS)
Peak frequency
(kHz)
300
270.77
60.67
30
10.54
292.968
400
87.89
30.67
20
2.21
398.437
500
20.75
75.00
39
1.2
492.187
600
10.99
0.00
22
1.27
580.078
650
5.19
0.00
4
0.15
632.812
Table 43.8 The variation of characteristic parameters after the signal going through the interface
and waveguide
Frequency of
electrical
signal (kHz)
The variation
of peak
amplitude (%)
The effect of
interfacial
enhancement
(%)
The variation
of energy (%)
The effect of
interfacial
enhancement
(%)
The variation
of peak
frequency (%)
300
−16.39
285.16
−20.69
188.21
0.00
400
−21.74
387.43
−64.47
175.89
0.00
500
−86.90
367.98
−88.13
76.24
−8.20
600
−73.71
780.12
−77.52
151.48
−2.94
650
−73.84
–
−93.12
–
−4.42
results can be gotten: (1) The changes of the frequencies are less after the wave
going through the interface and the variations are all within 10%; (2) The maximum
amplitude and energy increase a little, which consists with the theory given in Part 2;
(3) The maximum amplitude and energy are changed significantly with the increase
of frequency, which the maximum decrease of amplitude is 73.84% and that of the
energy is 93.12%; It is consistent with the attenuation law for acoustic wave that
given in Part 2.
43.4.3 Waveform Analysis
In common with Part 0.3, the signal of 500 kHz was used as an example to performed
a time–frequency analysis. The waves about 3.5 ms long before and after passing
through the interface were selected. Then wavelet transform was performed for these
waves. The wavelet scalogram is shown in Fig. 43.9. The following results can be
gotten: (1) According to the waveform, the duration time increases a lot after the
signal going through the rod waveguide. It results from the dispersion in rod waveguide; It is the same with Part 3; (2) In the wavelet scalogram, the number of peaks
increases. Compared with Fig. 43.7, it is shown that the number of peaks increased
X. Zeng et al.
Table 43.7 The characteristic parameters of the signal after the interface
Frequency of
electrical signal
(kHz)
Peak amplitude
(mV)
Up time (µs) Ring count Energy
(mV*mS)
Peak frequency
(kHz)
300
270.77
60.67
30
10.54
292.968
400
87.89
30.67
20
2.21
398.437
500
20.75
75.00
39
1.2
492.187
600
10.99
0.00
22
1.27
580.078
650
5.19
0.00
4
0.15
632.812
Table 43.8 The variation of characteristic parameters after the signal going through the interface
and waveguide
Frequency of
electrical
signal (kHz)
The variation
of peak
amplitude (%)
The effect of
interfacial
enhancement
(%)
The variation
of energy (%)
The effect of
interfacial
enhancement
(%)
The variation
of peak
frequency (%)
300
−16.39
285.16
−20.69
188.21
0.00
400
−21.74
387.43
−64.47
175.89
0.00
500
−86.90
367.98
−88.13
76.24
−8.20
600
−73.71
780.12
−77.52
151.48
−2.94
650
−73.84
–
−93.12
–
−4.42
results can be gotten: (1) The changes of the frequencies are less after the wave
going through the interface and the variations are all within 10%; (2) The maximum
amplitude and energy increase a little, which consists with the theory given in Part 2;
(3) The maximum amplitude and energy are changed significantly with the increase
of frequency, which the maximum decrease of amplitude is 73.84% and that of the
energy is 93.12%; It is consistent with the attenuation law for acoustic wave that
given in Part 2.
43.4.3 Waveform Analysis
In common with Part 0.3, the signal of 500 kHz was used as an example to performed
a time–frequency analysis. The waves about 3.5 ms long before and after passing
through the interface were selected. Then wavelet transform was performed for these
waves. The wavelet scalogram is shown in Fig. 43.9. The following results can be
gotten: (1) According to the waveform, the duration time increases a lot after the
signal going through the rod waveguide. It results from the dispersion in rod waveguide; It is the same with Part 3; (2) In the wavelet scalogram, the number of peaks
increases. Compared with Fig. 43.7, it is shown that the number of peaks increased