

43 The Influence of Rod Waveguide on Acoustic Emission …
497
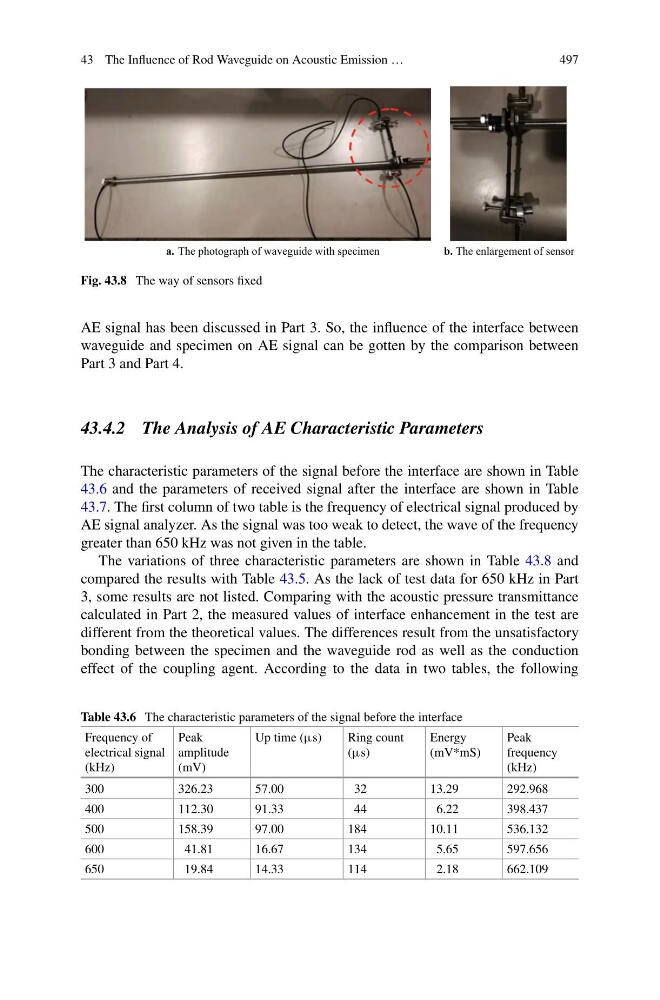
a. The photograph of waveguide with specimen
b. The enlargement of sensor
Fig. 43.8 The way of sensors fixed
AE signal has been discussed in Part 3. So, the influence of the interface between
waveguide and specimen on AE signal can be gotten by the comparison between
Part 3 and Part 4.
43.4.2 The Analysis of AE Characteristic Parameters
The characteristic parameters of the signal before the interface are shown in Table
43.6 and the parameters of received signal after the interface are shown in Table
43.7. The first column of two table is the frequency of electrical signal produced by
AE signal analyzer. As the signal was too weak to detect, the wave of the frequency
greater than 650 kHz was not given in the table.
The variations of three characteristic parameters are shown in Table 43.8 and
compared the results with Table 43.5. As the lack of test data for 650 kHz in Part
3, some results are not listed. Comparing with the acoustic pressure transmittance
calculated in Part 2, the measured values of interface enhancement in the test are
different from the theoretical values. The differences result from the unsatisfactory
bonding between the specimen and the waveguide rod as well as the conduction
effect of the coupling agent. According to the data in two tables, the following
Table 43.6 The characteristic parameters of the signal before the interface
Frequency of
electrical signal
(kHz)
Peak
amplitude
(mV)
Up time (µs)
Ring count
(µs)
Energy
(mV*mS)
Peak
frequency
(kHz)
300
326.23
57.00
32
13.29
292.968
400
112.30
91.33
44
6.22
398.437
500
158.39
97.00
184
10.11
536.132
600
41.81
16.67
134
5.65
597.656
650
19.84
14.33
114
2.18
662.109
497
a. The photograph of waveguide with specimen
b. The enlargement of sensor
Fig. 43.8 The way of sensors fixed
AE signal has been discussed in Part 3. So, the influence of the interface between
waveguide and specimen on AE signal can be gotten by the comparison between
Part 3 and Part 4.
43.4.2 The Analysis of AE Characteristic Parameters
The characteristic parameters of the signal before the interface are shown in Table
43.6 and the parameters of received signal after the interface are shown in Table
43.7. The first column of two table is the frequency of electrical signal produced by
AE signal analyzer. As the signal was too weak to detect, the wave of the frequency
greater than 650 kHz was not given in the table.
The variations of three characteristic parameters are shown in Table 43.8 and
compared the results with Table 43.5. As the lack of test data for 650 kHz in Part
3, some results are not listed. Comparing with the acoustic pressure transmittance
calculated in Part 2, the measured values of interface enhancement in the test are
different from the theoretical values. The differences result from the unsatisfactory
bonding between the specimen and the waveguide rod as well as the conduction
effect of the coupling agent. According to the data in two tables, the following
Table 43.6 The characteristic parameters of the signal before the interface
Frequency of
electrical signal
(kHz)
Peak
amplitude
(mV)
Up time (µs)
Ring count
(µs)
Energy
(mV*mS)
Peak
frequency
(kHz)
300
326.23
57.00
32
13.29
292.968
400
112.30
91.33
44
6.22
398.437
500
158.39
97.00
184
10.11
536.132
600
41.81
16.67
134
5.65
597.656
650
19.84
14.33
114
2.18
662.109