

496
X. Zeng et al.
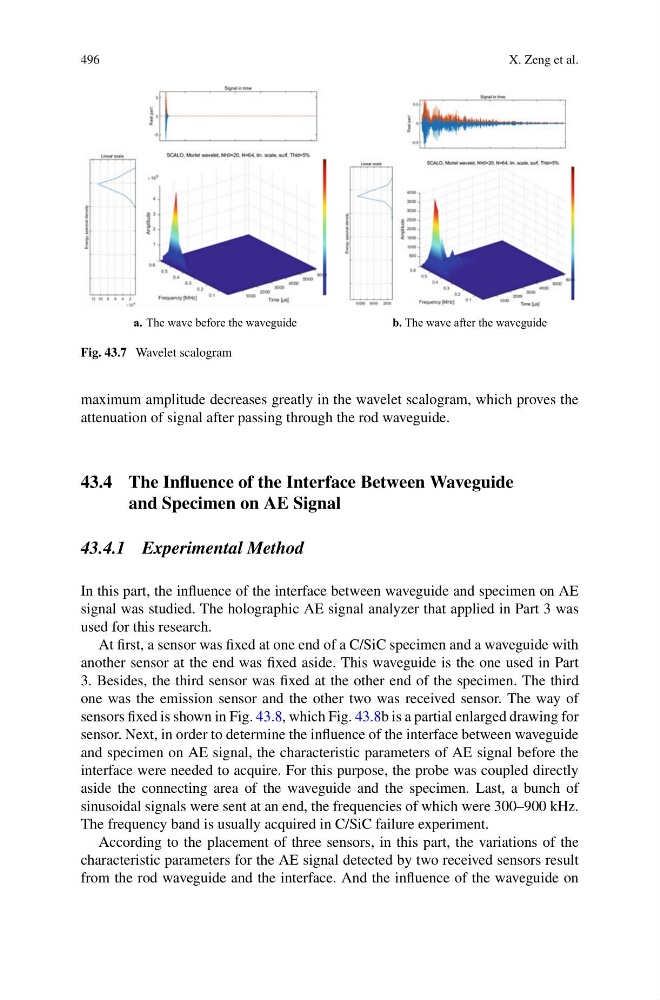
a. The wave before the waveguide
b. The wave after the waveguide
Fig. 43.7 Wavelet scalogram
maximum amplitude decreases greatly in the wavelet scalogram, which proves the
attenuation of signal after passing through the rod waveguide.
43.4 The Influence of the Interface Between Waveguide
and Specimen on AE Signal
43.4.1 Experimental Method
In this part, the influence of the interface between waveguide and specimen on AE
signal was studied. The holographic AE signal analyzer that applied in Part 3 was
used for this research.
At first, a sensor was fixed at one end of a C/SiC specimen and a waveguide with
another sensor at the end was fixed aside. This waveguide is the one used in Part
3. Besides, the third sensor was fixed at the other end of the specimen. The third
one was the emission sensor and the other two was received sensor. The way of
sensors fixed is shown in Fig. 43.8, which Fig. 43.8b is a partial enlarged drawing for
sensor. Next, in order to determine the influence of the interface between waveguide
and specimen on AE signal, the characteristic parameters of AE signal before the
interface were needed to acquire. For this purpose, the probe was coupled directly
aside the connecting area of the waveguide and the specimen. Last, a bunch of
sinusoidal signals were sent at an end, the frequencies of which were 300–900 kHz.
The frequency band is usually acquired in C/SiC failure experiment.
According to the placement of three sensors, in this part, the variations of the
characteristic parameters for the AE signal detected by two received sensors result
from the rod waveguide and the interface. And the influence of the waveguide on
X. Zeng et al.
a. The wave before the waveguide
b. The wave after the waveguide
Fig. 43.7 Wavelet scalogram
maximum amplitude decreases greatly in the wavelet scalogram, which proves the
attenuation of signal after passing through the rod waveguide.
43.4 The Influence of the Interface Between Waveguide
and Specimen on AE Signal
43.4.1 Experimental Method
In this part, the influence of the interface between waveguide and specimen on AE
signal was studied. The holographic AE signal analyzer that applied in Part 3 was
used for this research.
At first, a sensor was fixed at one end of a C/SiC specimen and a waveguide with
another sensor at the end was fixed aside. This waveguide is the one used in Part
3. Besides, the third sensor was fixed at the other end of the specimen. The third
one was the emission sensor and the other two was received sensor. The way of
sensors fixed is shown in Fig. 43.8, which Fig. 43.8b is a partial enlarged drawing for
sensor. Next, in order to determine the influence of the interface between waveguide
and specimen on AE signal, the characteristic parameters of AE signal before the
interface were needed to acquire. For this purpose, the probe was coupled directly
aside the connecting area of the waveguide and the specimen. Last, a bunch of
sinusoidal signals were sent at an end, the frequencies of which were 300–900 kHz.
The frequency band is usually acquired in C/SiC failure experiment.
According to the placement of three sensors, in this part, the variations of the
characteristic parameters for the AE signal detected by two received sensors result
from the rod waveguide and the interface. And the influence of the waveguide on