

41 Study of Acoustic Emission Response to Vortex …
469
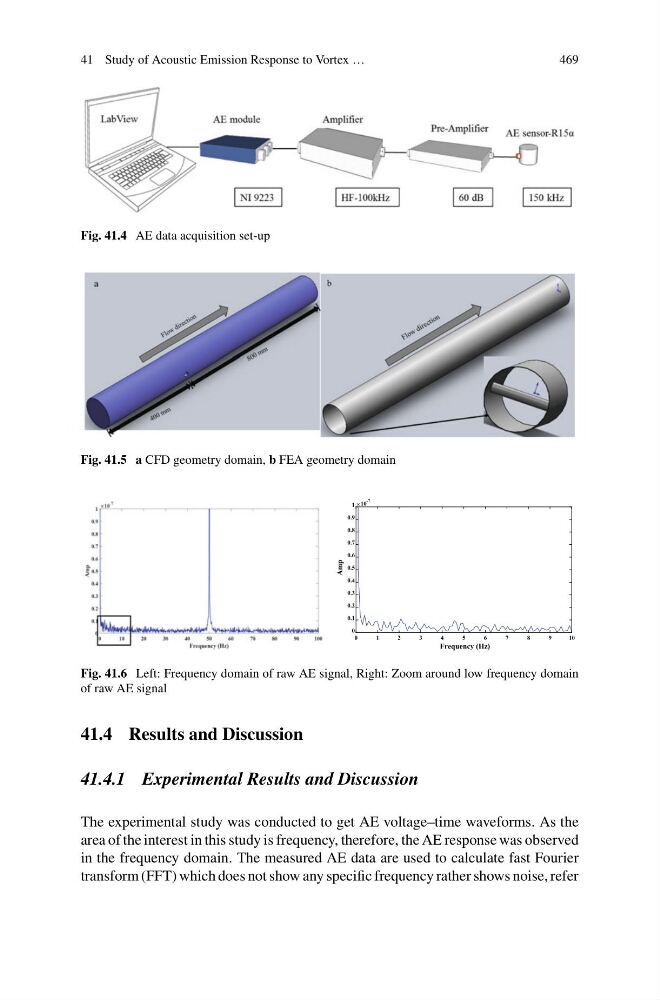
Fig. 41.4 AE data acquisition set-up
Fig. 41.5 a CFD geometry domain, b FEA geometry domain
0
1
2
3
4
5
6
7
8
9
1 0
Frequency (Hz)
0
0.1
0.2
0.3
0.4
0.5
0.6
0.7
0.8
0.9
1
Amp
10
-7
Fig. 41.6 Left: Frequency domain of raw AE signal, Right: Zoom around low frequency domain
of raw AE signal
41.4 Results and Discussion
41.4.1 Experimental Results and Discussion
The experimental study was conducted to get AE voltage–time waveforms. As the
area of the interest in this study is frequency, therefore, the AE response was observed
in the frequency domain. The measured AE data are used to calculate fast Fourier
transform (FFT) which does not show any specific frequency rather shows noise, refer
469
Fig. 41.4 AE data acquisition set-up
Fig. 41.5 a CFD geometry domain, b FEA geometry domain
0
1
2
3
4
5
6
7
8
9
1 0
Frequency (Hz)
0
0.1
0.2
0.3
0.4
0.5
0.6
0.7
0.8
0.9
1
Amp
10
-7
Fig. 41.6 Left: Frequency domain of raw AE signal, Right: Zoom around low frequency domain
of raw AE signal
41.4 Results and Discussion
41.4.1 Experimental Results and Discussion
The experimental study was conducted to get AE voltage–time waveforms. As the
area of the interest in this study is frequency, therefore, the AE response was observed
in the frequency domain. The measured AE data are used to calculate fast Fourier
transform (FFT) which does not show any specific frequency rather shows noise, refer