

470
F. Zohora et al.
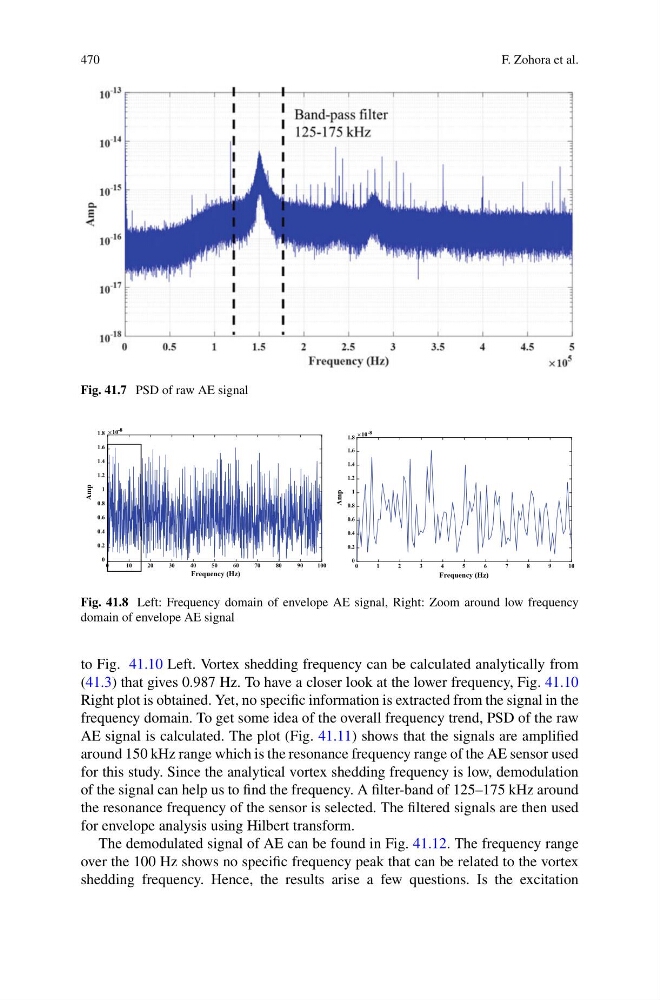
Fig. 41.7 PSD of raw AE signal
0
1 0
2 0
3 0
4 0
5 0
6 0
7 0
8 0
9 0
1 0 0
Frequency (Hz)
0
0.2
0.4
0.6
0.8
1
1.2
1.4
1.6
1.8
Amp
10 -8
0
1
2
3
4
5
6
7
8
9
1 0
Frequency (Hz)
0
0.2
0.4
0.6
0.8
1
1.2
1.4
1.6
1.8
Amp
10 -8
Fig. 41.8 Left: Frequency domain of envelope AE signal, Right: Zoom around low frequency
domain of envelope AE signal
to Fig. 41.10 Left. Vortex shedding frequency can be calculated analytically from
(41.3) that gives 0.987 Hz. To have a closer look at the lower frequency, Fig. 41.10
Right plot is obtained. Yet, no specific information is extracted from the signal in the
frequency domain. To get some idea of the overall frequency trend, PSD of the raw
AE signal is calculated. The plot (Fig. 41.11) shows that the signals are amplified
around 150 kHz range which is the resonance frequency range of the AE sensor used
for this study. Since the analytical vortex shedding frequency is low, demodulation
of the signal can help us to find the frequency. A filter-band of 125–175 kHz around
the resonance frequency of the sensor is selected. The filtered signals are then used
for envelope analysis using Hilbert transform.
The demodulated signal of AE can be found in Fig. 41.12. The frequency range
over the 100 Hz shows no specific frequency peak that can be related to the vortex
shedding frequency. Hence, the results arise a few questions. Is the excitation
F. Zohora et al.
Fig. 41.7 PSD of raw AE signal
0
1 0
2 0
3 0
4 0
5 0
6 0
7 0
8 0
9 0
1 0 0
Frequency (Hz)
0
0.2
0.4
0.6
0.8
1
1.2
1.4
1.6
1.8
Amp
10 -8
0
1
2
3
4
5
6
7
8
9
1 0
Frequency (Hz)
0
0.2
0.4
0.6
0.8
1
1.2
1.4
1.6
1.8
Amp
10 -8
Fig. 41.8 Left: Frequency domain of envelope AE signal, Right: Zoom around low frequency
domain of envelope AE signal
to Fig. 41.10 Left. Vortex shedding frequency can be calculated analytically from
(41.3) that gives 0.987 Hz. To have a closer look at the lower frequency, Fig. 41.10
Right plot is obtained. Yet, no specific information is extracted from the signal in the
frequency domain. To get some idea of the overall frequency trend, PSD of the raw
AE signal is calculated. The plot (Fig. 41.11) shows that the signals are amplified
around 150 kHz range which is the resonance frequency range of the AE sensor used
for this study. Since the analytical vortex shedding frequency is low, demodulation
of the signal can help us to find the frequency. A filter-band of 125–175 kHz around
the resonance frequency of the sensor is selected. The filtered signals are then used
for envelope analysis using Hilbert transform.
The demodulated signal of AE can be found in Fig. 41.12. The frequency range
over the 100 Hz shows no specific frequency peak that can be related to the vortex
shedding frequency. Hence, the results arise a few questions. Is the excitation