

400
Y. Liu et al.
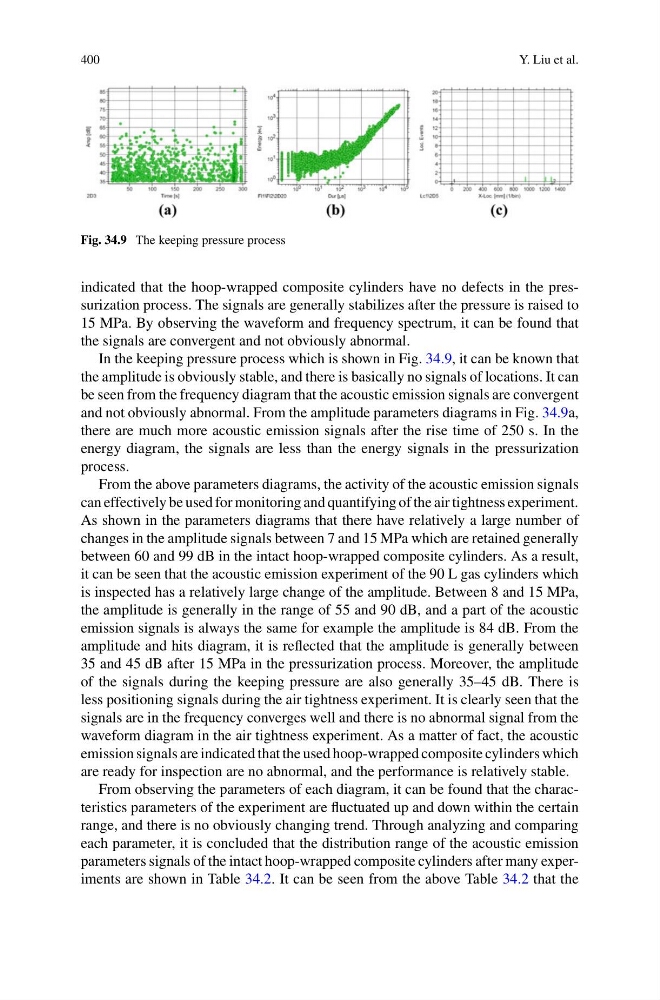
Fig. 34.9 The keeping pressure process
indicated that the hoop-wrapped composite cylinders have no defects in the pressurization process. The signals are generally stabilizes after the pressure is raised to
15 MPa. By observing the waveform and frequency spectrum, it can be found that
the signals are convergent and not obviously abnormal.
In the keeping pressure process which is shown in Fig. 34.9, it can be known that
the amplitude is obviously stable, and there is basically no signals of locations. It can
be seen from the frequency diagram that the acoustic emission signals are convergent
and not obviously abnormal. From the amplitude parameters diagrams in Fig. 34.9a,
there are much more acoustic emission signals after the rise time of 250 s. In the
energy diagram, the signals are less than the energy signals in the pressurization
process.
From the above parameters diagrams, the activity of the acoustic emission signals
can effectively be used for monitoring and quantifying of the air tightness experiment.
As shown in the parameters diagrams that there have relatively a large number of
changes in the amplitude signals between 7 and 15 MPa which are retained generally
between 60 and 99 dB in the intact hoop-wrapped composite cylinders. As a result,
it can be seen that the acoustic emission experiment of the 90 L gas cylinders which
is inspected has a relatively large change of the amplitude. Between 8 and 15 MPa,
the amplitude is generally in the range of 55 and 90 dB, and a part of the acoustic
emission signals is always the same for example the amplitude is 84 dB. From the
amplitude and hits diagram, it is reflected that the amplitude is generally between
35 and 45 dB after 15 MPa in the pressurization process. Moreover, the amplitude
of the signals during the keeping pressure are also generally 35–45 dB. There is
less positioning signals during the air tightness experiment. It is clearly seen that the
signals are in the frequency converges well and there is no abnormal signal from the
waveform diagram in the air tightness experiment. As a matter of fact, the acoustic
emission signals are indicated that the used hoop-wrapped composite cylinders which
are ready for inspection are no abnormal, and the performance is relatively stable.
From observing the parameters of each diagram, it can be found that the characteristics parameters of the experiment are fluctuated up and down within the certain
range, and there is no obviously changing trend. Through analyzing and comparing
each parameter, it is concluded that the distribution range of the acoustic emission
parameters signals of the intact hoop-wrapped composite cylinders after many experiments are shown in Table 34.2. It can be seen from the above Table 34.2 that the
Y. Liu et al.
Fig. 34.9 The keeping pressure process
indicated that the hoop-wrapped composite cylinders have no defects in the pressurization process. The signals are generally stabilizes after the pressure is raised to
15 MPa. By observing the waveform and frequency spectrum, it can be found that
the signals are convergent and not obviously abnormal.
In the keeping pressure process which is shown in Fig. 34.9, it can be known that
the amplitude is obviously stable, and there is basically no signals of locations. It can
be seen from the frequency diagram that the acoustic emission signals are convergent
and not obviously abnormal. From the amplitude parameters diagrams in Fig. 34.9a,
there are much more acoustic emission signals after the rise time of 250 s. In the
energy diagram, the signals are less than the energy signals in the pressurization
process.
From the above parameters diagrams, the activity of the acoustic emission signals
can effectively be used for monitoring and quantifying of the air tightness experiment.
As shown in the parameters diagrams that there have relatively a large number of
changes in the amplitude signals between 7 and 15 MPa which are retained generally
between 60 and 99 dB in the intact hoop-wrapped composite cylinders. As a result,
it can be seen that the acoustic emission experiment of the 90 L gas cylinders which
is inspected has a relatively large change of the amplitude. Between 8 and 15 MPa,
the amplitude is generally in the range of 55 and 90 dB, and a part of the acoustic
emission signals is always the same for example the amplitude is 84 dB. From the
amplitude and hits diagram, it is reflected that the amplitude is generally between
35 and 45 dB after 15 MPa in the pressurization process. Moreover, the amplitude
of the signals during the keeping pressure are also generally 35–45 dB. There is
less positioning signals during the air tightness experiment. It is clearly seen that the
signals are in the frequency converges well and there is no abnormal signal from the
waveform diagram in the air tightness experiment. As a matter of fact, the acoustic
emission signals are indicated that the used hoop-wrapped composite cylinders which
are ready for inspection are no abnormal, and the performance is relatively stable.
From observing the parameters of each diagram, it can be found that the characteristics parameters of the experiment are fluctuated up and down within the certain
range, and there is no obviously changing trend. Through analyzing and comparing
each parameter, it is concluded that the distribution range of the acoustic emission
parameters signals of the intact hoop-wrapped composite cylinders after many experiments are shown in Table 34.2. It can be seen from the above Table 34.2 that the