

34 Application and Research of Acoustic Emission …
399
Table 34.1 The AE parameter distribution of AE signals
AE
parameters
Range
Distribution
rang
AE
parameters
Range
Distribution
rang
Amplitude
(dB)
35–84
35–70
Duration
time(µs)
1–99,999
1800–99,999
Energy (eu)
1–629,758.4
1–650
Rise time
(µs)
1–99,999
1–1800
Hits
1–12,500
1–12,500
RMS (µV)
2.0–84
2.0–11
From the diagrams for the acoustic emission amplitude and hits, they are reflected
that the signals are generally between 35–70 dB after 15 MP. After the rise time
of 350 s, the signals are began to become flat. It is clearly seen that the signals are
scattered and the changes are relatively large in the waveform diagram during the
pressurization process.
34.3.2 Air Tightness Experiment in Intact Hoop-Wrapped
Composite Cylinder
The acoustic emission experiment was performed after the internal appearance test,
bottle thread test, and water pressure test in the air tightness experiment of the
intact hoop-wrapped composite cylinders. In the experiment, the acoustic emission
signals of the cylinders was active which the pressure is between in 8 and 20 MP.
The following parameters diagrams show that the characteristics of the collecting
signals during the pressurization process and keeping pressure process. The parameters diagrams are usually used for showing the features of the acoustic emission
sources.
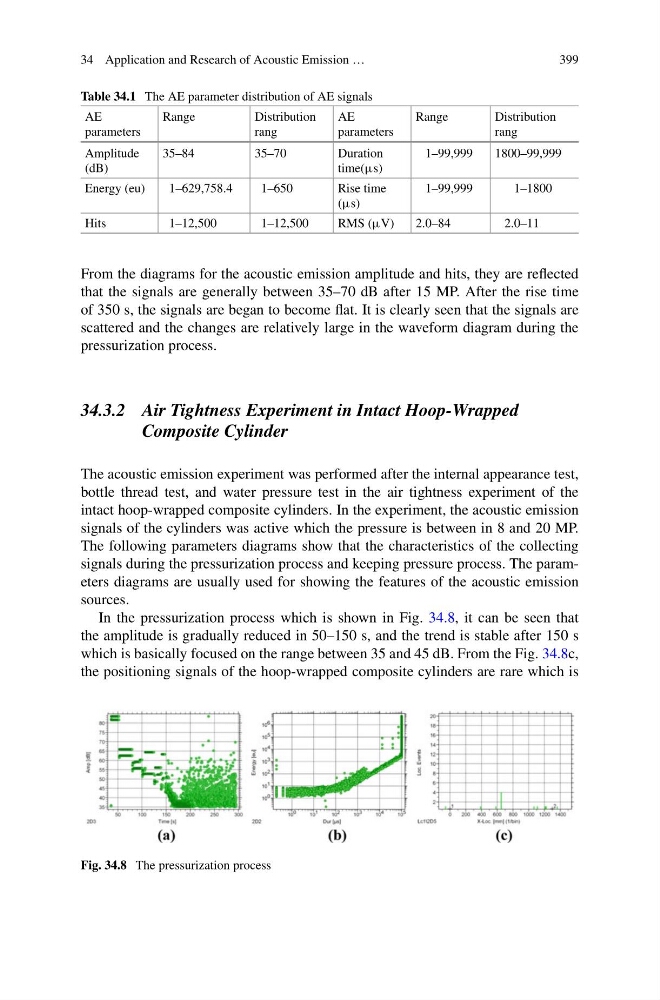
In the pressurization process which is shown in Fig. 34.8, it can be seen that
the amplitude is gradually reduced in 50–150 s, and the trend is stable after 150 s
which is basically focused on the range between 35 and 45 dB. From the Fig. 34.8c,
the positioning signals of the hoop-wrapped composite cylinders are rare which is
Fig. 34.8 The pressurization process
399
Table 34.1 The AE parameter distribution of AE signals
AE
parameters
Range
Distribution
rang
AE
parameters
Range
Distribution
rang
Amplitude
(dB)
35–84
35–70
Duration
time(µs)
1–99,999
1800–99,999
Energy (eu)
1–629,758.4
1–650
Rise time
(µs)
1–99,999
1–1800
Hits
1–12,500
1–12,500
RMS (µV)
2.0–84
2.0–11
From the diagrams for the acoustic emission amplitude and hits, they are reflected
that the signals are generally between 35–70 dB after 15 MP. After the rise time
of 350 s, the signals are began to become flat. It is clearly seen that the signals are
scattered and the changes are relatively large in the waveform diagram during the
pressurization process.
34.3.2 Air Tightness Experiment in Intact Hoop-Wrapped
Composite Cylinder
The acoustic emission experiment was performed after the internal appearance test,
bottle thread test, and water pressure test in the air tightness experiment of the
intact hoop-wrapped composite cylinders. In the experiment, the acoustic emission
signals of the cylinders was active which the pressure is between in 8 and 20 MP.
The following parameters diagrams show that the characteristics of the collecting
signals during the pressurization process and keeping pressure process. The parameters diagrams are usually used for showing the features of the acoustic emission
sources.
In the pressurization process which is shown in Fig. 34.8, it can be seen that
the amplitude is gradually reduced in 50–150 s, and the trend is stable after 150 s
which is basically focused on the range between 35 and 45 dB. From the Fig. 34.8c,
the positioning signals of the hoop-wrapped composite cylinders are rare which is
Fig. 34.8 The pressurization process