

398
Y. Liu et al.
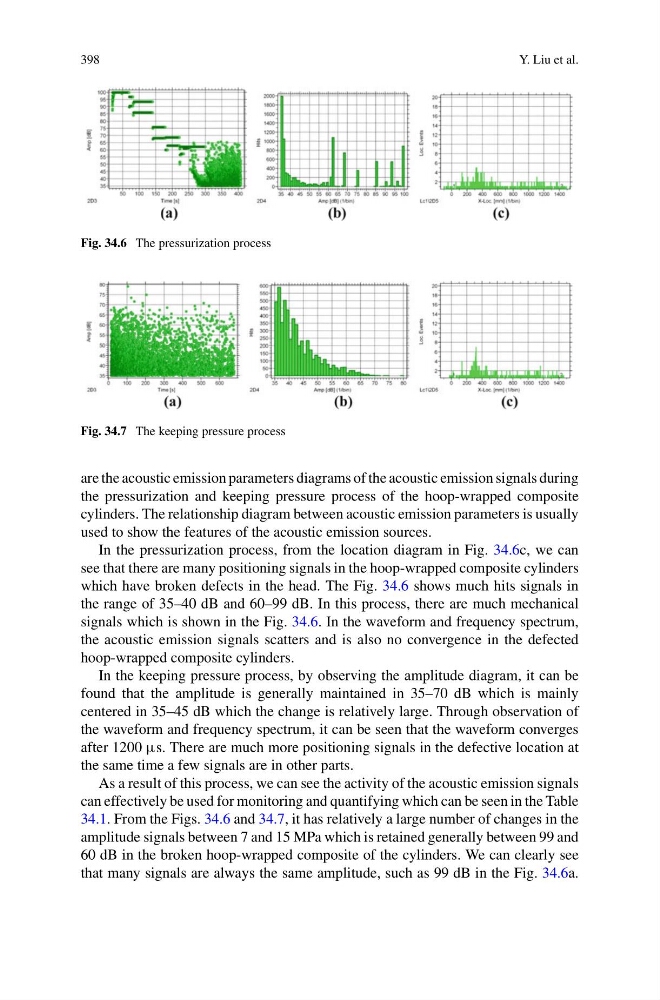
Fig. 34.6 The pressurization process
Fig. 34.7 The keeping pressure process
are the acoustic emission parameters diagrams of the acoustic emission signals during
the pressurization and keeping pressure process of the hoop-wrapped composite
cylinders. The relationship diagram between acoustic emission parameters is usually
used to show the features of the acoustic emission sources.
In the pressurization process, from the location diagram in Fig. 34.6c, we can
see that there are many positioning signals in the hoop-wrapped composite cylinders
which have broken defects in the head. The Fig. 34.6 shows much hits signals in
the range of 35–40 dB and 60–99 dB. In this process, there are much mechanical
signals which is shown in the Fig. 34.6. In the waveform and frequency spectrum,
the acoustic emission signals scatters and is also no convergence in the defected
hoop-wrapped composite cylinders.
In the keeping pressure process, by observing the amplitude diagram, it can be
found that the amplitude is generally maintained in 35–70 dB which is mainly
centered in 35–45 dB which the change is relatively large. Through observation of
the waveform and frequency spectrum, it can be seen that the waveform converges
after 1200 µs. There are much more positioning signals in the defective location at
the same time a few signals are in other parts.
As a result of this process, we can see the activity of the acoustic emission signals
can effectively be used for monitoring and quantifying which can be seen in the Table
34.1. From the Figs. 34.6 and 34.7, it has relatively a large number of changes in the
amplitude signals between 7 and 15 MPa which is retained generally between 99 and
60 dB in the broken hoop-wrapped composite of the cylinders. We can clearly see
that many signals are always the same amplitude, such as 99 dB in the Fig. 34.6a.
Y. Liu et al.
Fig. 34.6 The pressurization process
Fig. 34.7 The keeping pressure process
are the acoustic emission parameters diagrams of the acoustic emission signals during
the pressurization and keeping pressure process of the hoop-wrapped composite
cylinders. The relationship diagram between acoustic emission parameters is usually
used to show the features of the acoustic emission sources.
In the pressurization process, from the location diagram in Fig. 34.6c, we can
see that there are many positioning signals in the hoop-wrapped composite cylinders
which have broken defects in the head. The Fig. 34.6 shows much hits signals in
the range of 35–40 dB and 60–99 dB. In this process, there are much mechanical
signals which is shown in the Fig. 34.6. In the waveform and frequency spectrum,
the acoustic emission signals scatters and is also no convergence in the defected
hoop-wrapped composite cylinders.
In the keeping pressure process, by observing the amplitude diagram, it can be
found that the amplitude is generally maintained in 35–70 dB which is mainly
centered in 35–45 dB which the change is relatively large. Through observation of
the waveform and frequency spectrum, it can be seen that the waveform converges
after 1200 µs. There are much more positioning signals in the defective location at
the same time a few signals are in other parts.
As a result of this process, we can see the activity of the acoustic emission signals
can effectively be used for monitoring and quantifying which can be seen in the Table
34.1. From the Figs. 34.6 and 34.7, it has relatively a large number of changes in the
amplitude signals between 7 and 15 MPa which is retained generally between 99 and
60 dB in the broken hoop-wrapped composite of the cylinders. We can clearly see
that many signals are always the same amplitude, such as 99 dB in the Fig. 34.6a.