

316
Y. Yang et al.
26.3 Target Area
26.3.1 Elastic Wave Tomography
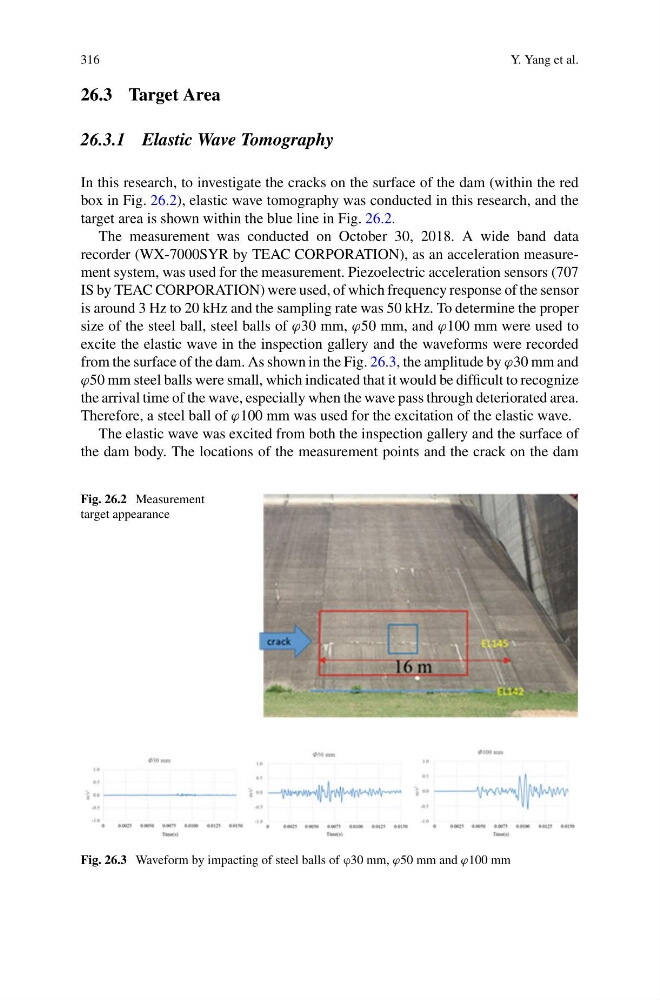
In this research, to investigate the cracks on the surface of the dam (within the red
box in Fig. 26.2), elastic wave tomography was conducted in this research, and the
target area is shown within the blue line in Fig. 26.2.
The measurement was conducted on October 30, 2018. A wide band data
recorder (WX-7000SYR by TEAC CORPORATION), as an acceleration measurement system, was used for the measurement. Piezoelectric acceleration sensors (707
IS by TEAC CORPORATION) were used, of which frequency response of the sensor
is around 3 Hz to 20 kHz and the sampling rate was 50 kHz. To determine the proper
size of the steel ball, steel balls of ϕ30 mm, ϕ50 mm, and ϕ100 mm were used to
excite the elastic wave in the inspection gallery and the waveforms were recorded
from the surface of the dam. As shown in the Fig. 26.3, the amplitude by ϕ30 mm and
ϕ50 mm steel balls were small, which indicated that it would be difficult to recognize
the arrival time of the wave, especially when the wave pass through deteriorated area.
Therefore, a steel ball of ϕ100 mm was used for the excitation of the elastic wave.
The elastic wave was excited from both the inspection gallery and the surface of
the dam body. The locations of the measurement points and the crack on the dam
Fig. 26.2 Measurement
target appearance
Fig. 26.3 Waveform by impacting of steel balls of ϕ30 mm, ϕ50 mm and ϕ100 mm
Y. Yang et al.
26.3 Target Area
26.3.1 Elastic Wave Tomography
In this research, to investigate the cracks on the surface of the dam (within the red
box in Fig. 26.2), elastic wave tomography was conducted in this research, and the
target area is shown within the blue line in Fig. 26.2.
The measurement was conducted on October 30, 2018. A wide band data
recorder (WX-7000SYR by TEAC CORPORATION), as an acceleration measurement system, was used for the measurement. Piezoelectric acceleration sensors (707
IS by TEAC CORPORATION) were used, of which frequency response of the sensor
is around 3 Hz to 20 kHz and the sampling rate was 50 kHz. To determine the proper
size of the steel ball, steel balls of ϕ30 mm, ϕ50 mm, and ϕ100 mm were used to
excite the elastic wave in the inspection gallery and the waveforms were recorded
from the surface of the dam. As shown in the Fig. 26.3, the amplitude by ϕ30 mm and
ϕ50 mm steel balls were small, which indicated that it would be difficult to recognize
the arrival time of the wave, especially when the wave pass through deteriorated area.
Therefore, a steel ball of ϕ100 mm was used for the excitation of the elastic wave.
The elastic wave was excited from both the inspection gallery and the surface of
the dam body. The locations of the measurement points and the crack on the dam
Fig. 26.2 Measurement
target appearance
Fig. 26.3 Waveform by impacting of steel balls of ϕ30 mm, ϕ50 mm and ϕ100 mm