

25 Detection and Evaluation of Vascular Network Based …
305
hits are produced with relatively higher energy. That phenomenon matches with the
mechanical response as well.
During the stage of overlap of precracking and reloading, theoretically the AE
activities from this period of time are supposed to be coming from two different type
of damage sources before the previous damage level (recognized by the value of
CMOD) is exceeded after the specimens are healed. One of them is resulting from
the sources of generation of new cracks formation. This is simply due to the fact
that the healing effect, such as the healing agent available in the vascular network
based specimen, possess a much stronger bond effect with original host matrix,
which result in the bonding surface of cracked area possess higher strength than the
surrounding original host material, and compel the new cracks to be occurred aside in
a different position. Another type is primarily the sources from the damage of healed
crack surfaces. These healed cracks, result from the filling of the adhesive in the
vascular network due to the capillary force when microcracks appear, can fill those
tiny interspaces very well. However, in terms of the recovery of mechanical properties
and the effect of healed area to the overall structure has been less investigated.
Therefore, the bonded crack surfaces by the filling adhesive agents could still be
weaker regarding the mechanical properties than that of the original host matrix.
Thus, it is potentially to be damaged again before the maximum load reached.
It also presents a relative dense area of AE hits for each self-healing specimen
compared with control beams before the dotted line due to the new damage after the
injection of healing agent. Moreover, from those self-healing specimens, the longer
the healing time, the more hits are, which reflect better healing effect. Therefore, from
the perspective of AE hits, the level of healing effect could be qualitatively assessed
in the order of healing time 1-h < 24-h < 3-days. These results demonstrate that the
self-healing capability is indeed related to different reaction time of the adhesive and
host matrix.
25.3.2.2 Evolution of AE Hits
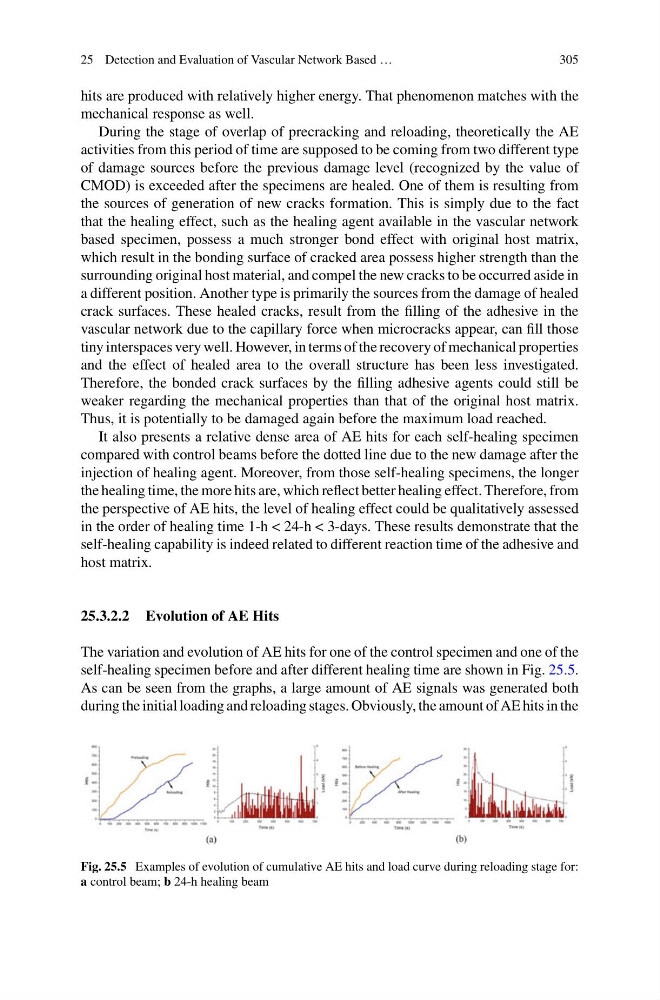
The variation and evolution of AE hits for one of the control specimen and one of the
self-healing specimen before and after different healing time are shown in Fig. 25.5.
As can be seen from the graphs, a large amount of AE signals was generated both
during the initial loading and reloading stages. Obviously, the amount of AE hits in the
Fig. 25.5 Examples of evolution of cumulative AE hits and load curve during reloading stage for:
a control beam; b 24-h healing beam
305
hits are produced with relatively higher energy. That phenomenon matches with the
mechanical response as well.
During the stage of overlap of precracking and reloading, theoretically the AE
activities from this period of time are supposed to be coming from two different type
of damage sources before the previous damage level (recognized by the value of
CMOD) is exceeded after the specimens are healed. One of them is resulting from
the sources of generation of new cracks formation. This is simply due to the fact
that the healing effect, such as the healing agent available in the vascular network
based specimen, possess a much stronger bond effect with original host matrix,
which result in the bonding surface of cracked area possess higher strength than the
surrounding original host material, and compel the new cracks to be occurred aside in
a different position. Another type is primarily the sources from the damage of healed
crack surfaces. These healed cracks, result from the filling of the adhesive in the
vascular network due to the capillary force when microcracks appear, can fill those
tiny interspaces very well. However, in terms of the recovery of mechanical properties
and the effect of healed area to the overall structure has been less investigated.
Therefore, the bonded crack surfaces by the filling adhesive agents could still be
weaker regarding the mechanical properties than that of the original host matrix.
Thus, it is potentially to be damaged again before the maximum load reached.
It also presents a relative dense area of AE hits for each self-healing specimen
compared with control beams before the dotted line due to the new damage after the
injection of healing agent. Moreover, from those self-healing specimens, the longer
the healing time, the more hits are, which reflect better healing effect. Therefore, from
the perspective of AE hits, the level of healing effect could be qualitatively assessed
in the order of healing time 1-h < 24-h < 3-days. These results demonstrate that the
self-healing capability is indeed related to different reaction time of the adhesive and
host matrix.
25.3.2.2 Evolution of AE Hits
The variation and evolution of AE hits for one of the control specimen and one of the
self-healing specimen before and after different healing time are shown in Fig. 25.5.
As can be seen from the graphs, a large amount of AE signals was generated both
during the initial loading and reloading stages. Obviously, the amount of AE hits in the
Fig. 25.5 Examples of evolution of cumulative AE hits and load curve during reloading stage for:
a control beam; b 24-h healing beam