

304
Y. Wang et al.
Around 60% ~ 80% original strength of specimens (batches of SH-A, SH-B and
SH-C) were recovered and the maximum reached 89.4%.
25.3.2 Characteristics of AE Signals from Damage
in Self-healing Concrete
25.3.2.1 The Amounts of AE Hits
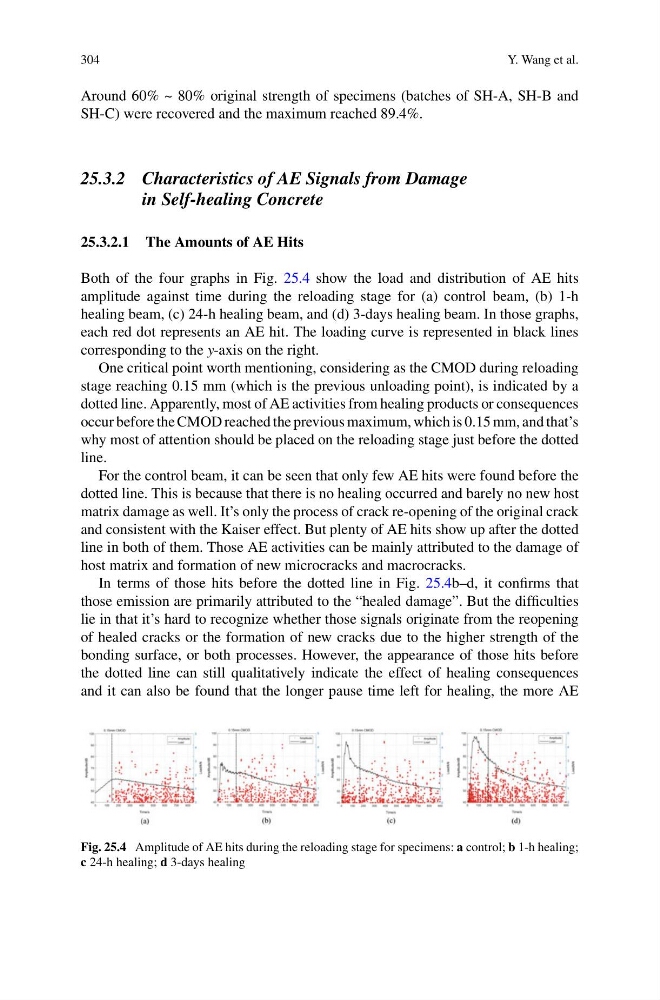
Both of the four graphs in Fig. 25.4 show the load and distribution of AE hits
amplitude against time during the reloading stage for (a) control beam, (b) 1-h
healing beam, (c) 24-h healing beam, and (d) 3-days healing beam. In those graphs,
each red dot represents an AE hit. The loading curve is represented in black lines
corresponding to the y-axis on the right.
One critical point worth mentioning, considering as the CMOD during reloading
stage reaching 0.15 mm (which is the previous unloading point), is indicated by a
dotted line. Apparently, most of AE activities from healing products or consequences
occur before the CMOD reached the previous maximum, which is 0.15 mm, and that’s
why most of attention should be placed on the reloading stage just before the dotted
line.
For the control beam, it can be seen that only few AE hits were found before the
dotted line. This is because that there is no healing occurred and barely no new host
matrix damage as well. It’s only the process of crack re-opening of the original crack
and consistent with the Kaiser effect. But plenty of AE hits show up after the dotted
line in both of them. Those AE activities can be mainly attributed to the damage of
host matrix and formation of new microcracks and macrocracks.
In terms of those hits before the dotted line in Fig. 25.4b–d, it confirms that
those emission are primarily attributed to the “healed damage”. But the difficulties
lie in that it’s hard to recognize whether those signals originate from the reopening
of healed cracks or the formation of new cracks due to the higher strength of the
bonding surface, or both processes. However, the appearance of those hits before
the dotted line can still qualitatively indicate the effect of healing consequences
and it can also be found that the longer pause time left for healing, the more AE
Fig. 25.4 Amplitude of AE hits during the reloading stage for specimens: a control; b 1-h healing;
c 24-h healing; d 3-days healing
Y. Wang et al.
Around 60% ~ 80% original strength of specimens (batches of SH-A, SH-B and
SH-C) were recovered and the maximum reached 89.4%.
25.3.2 Characteristics of AE Signals from Damage
in Self-healing Concrete
25.3.2.1 The Amounts of AE Hits
Both of the four graphs in Fig. 25.4 show the load and distribution of AE hits
amplitude against time during the reloading stage for (a) control beam, (b) 1-h
healing beam, (c) 24-h healing beam, and (d) 3-days healing beam. In those graphs,
each red dot represents an AE hit. The loading curve is represented in black lines
corresponding to the y-axis on the right.
One critical point worth mentioning, considering as the CMOD during reloading
stage reaching 0.15 mm (which is the previous unloading point), is indicated by a
dotted line. Apparently, most of AE activities from healing products or consequences
occur before the CMOD reached the previous maximum, which is 0.15 mm, and that’s
why most of attention should be placed on the reloading stage just before the dotted
line.
For the control beam, it can be seen that only few AE hits were found before the
dotted line. This is because that there is no healing occurred and barely no new host
matrix damage as well. It’s only the process of crack re-opening of the original crack
and consistent with the Kaiser effect. But plenty of AE hits show up after the dotted
line in both of them. Those AE activities can be mainly attributed to the damage of
host matrix and formation of new microcracks and macrocracks.
In terms of those hits before the dotted line in Fig. 25.4b–d, it confirms that
those emission are primarily attributed to the “healed damage”. But the difficulties
lie in that it’s hard to recognize whether those signals originate from the reopening
of healed cracks or the formation of new cracks due to the higher strength of the
bonding surface, or both processes. However, the appearance of those hits before
the dotted line can still qualitatively indicate the effect of healing consequences
and it can also be found that the longer pause time left for healing, the more AE
Fig. 25.4 Amplitude of AE hits during the reloading stage for specimens: a control; b 1-h healing;
c 24-h healing; d 3-days healing