

232
H. Luo et al.
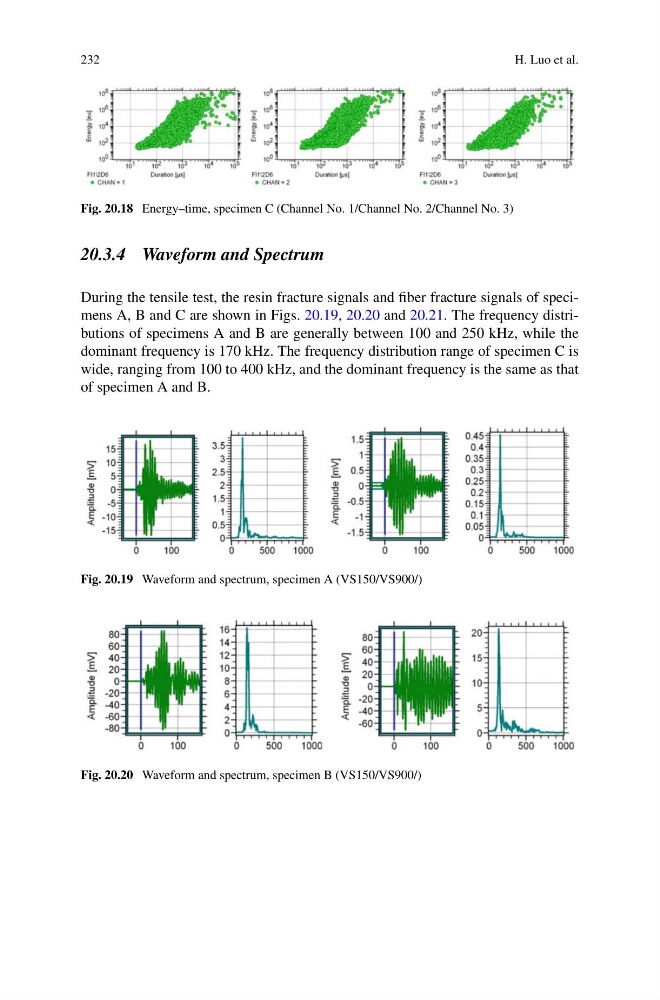
Fig. 20.18 Energy–time, specimen C (Channel No. 1/Channel No. 2/Channel No. 3)
20.3.4 Waveform and Spectrum
During the tensile test, the resin fracture signals and fiber fracture signals of specimens A, B and C are shown in Figs. 20.19, 20.20 and 20.21. The frequency distributions of specimens A and B are generally between 100 and 250 kHz, while the
dominant frequency is 170 kHz. The frequency distribution range of specimen C is
wide, ranging from 100 to 400 kHz, and the dominant frequency is the same as that
of specimen A and B.
Fig. 20.19 Waveform and spectrum, specimen A (VS150/VS900/)
Fig. 20.20 Waveform and spectrum, specimen B (VS150/VS900/)
H. Luo et al.
Fig. 20.18 Energy–time, specimen C (Channel No. 1/Channel No. 2/Channel No. 3)
20.3.4 Waveform and Spectrum
During the tensile test, the resin fracture signals and fiber fracture signals of specimens A, B and C are shown in Figs. 20.19, 20.20 and 20.21. The frequency distributions of specimens A and B are generally between 100 and 250 kHz, while the
dominant frequency is 170 kHz. The frequency distribution range of specimen C is
wide, ranging from 100 to 400 kHz, and the dominant frequency is the same as that
of specimen A and B.
Fig. 20.19 Waveform and spectrum, specimen A (VS150/VS900/)
Fig. 20.20 Waveform and spectrum, specimen B (VS150/VS900/)