

230
H. Luo et al.
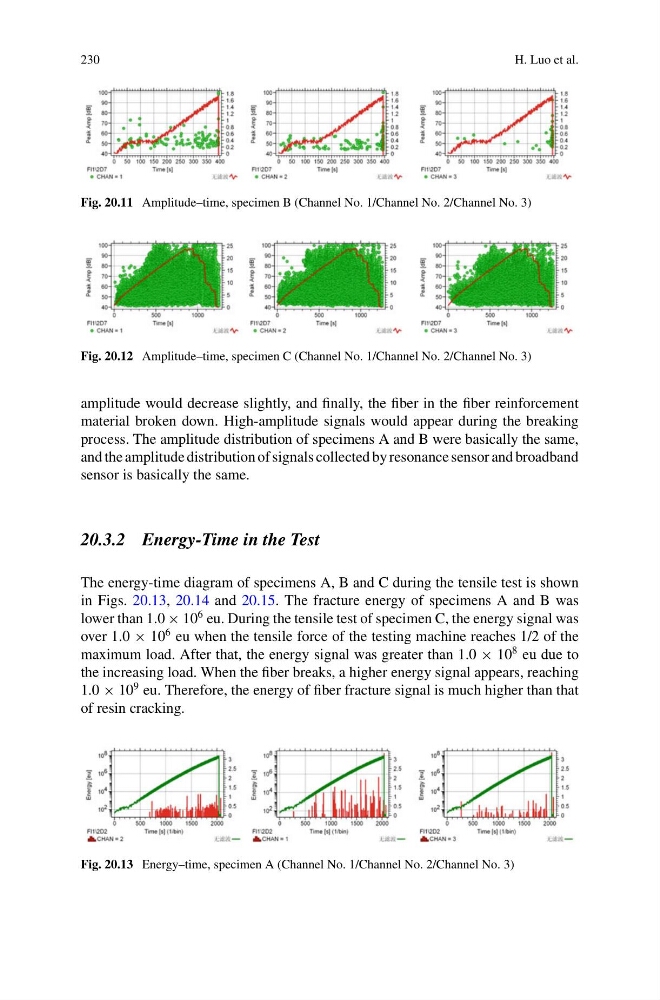
Fig. 20.11 Amplitude–time, specimen B (Channel No. 1/Channel No. 2/Channel No. 3)
Fig. 20.12 Amplitude–time, specimen C (Channel No. 1/Channel No. 2/Channel No. 3)
amplitude would decrease slightly, and finally, the fiber in the fiber reinforcement
material broken down. High-amplitude signals would appear during the breaking
process. The amplitude distribution of specimens A and B were basically the same,
and the amplitude distribution of signals collected by resonance sensor and broadband
sensor is basically the same.
20.3.2 Energy-Time in the Test
The energy-time diagram of specimens A, B and C during the tensile test is shown
in Figs. 20.13, 20.14 and 20.15. The fracture energy of specimens A and B was
lower than 1.0 × 10
6 eu. During the tensile test of specimen C, the energy signal was
over 1.0 × 10
6 eu when the tensile force of the testing machine reaches 1/2 of the
maximum load. After that, the energy signal was greater than 1.0 × 10
8 eu due to
the increasing load. When the fiber breaks, a higher energy signal appears, reaching
1.0 × 10
9 eu. Therefore, the energy of fiber fracture signal is much higher than that
of resin cracking.
Fig. 20.13 Energy–time, specimen A (Channel No. 1/Channel No. 2/Channel No. 3)
H. Luo et al.
Fig. 20.11 Amplitude–time, specimen B (Channel No. 1/Channel No. 2/Channel No. 3)
Fig. 20.12 Amplitude–time, specimen C (Channel No. 1/Channel No. 2/Channel No. 3)
amplitude would decrease slightly, and finally, the fiber in the fiber reinforcement
material broken down. High-amplitude signals would appear during the breaking
process. The amplitude distribution of specimens A and B were basically the same,
and the amplitude distribution of signals collected by resonance sensor and broadband
sensor is basically the same.
20.3.2 Energy-Time in the Test
The energy-time diagram of specimens A, B and C during the tensile test is shown
in Figs. 20.13, 20.14 and 20.15. The fracture energy of specimens A and B was
lower than 1.0 × 10
6 eu. During the tensile test of specimen C, the energy signal was
over 1.0 × 10
6 eu when the tensile force of the testing machine reaches 1/2 of the
maximum load. After that, the energy signal was greater than 1.0 × 10
8 eu due to
the increasing load. When the fiber breaks, a higher energy signal appears, reaching
1.0 × 10
9 eu. Therefore, the energy of fiber fracture signal is much higher than that
of resin cracking.
Fig. 20.13 Energy–time, specimen A (Channel No. 1/Channel No. 2/Channel No. 3)