

20 Experiment Research on Tensile Process of Glass…
229
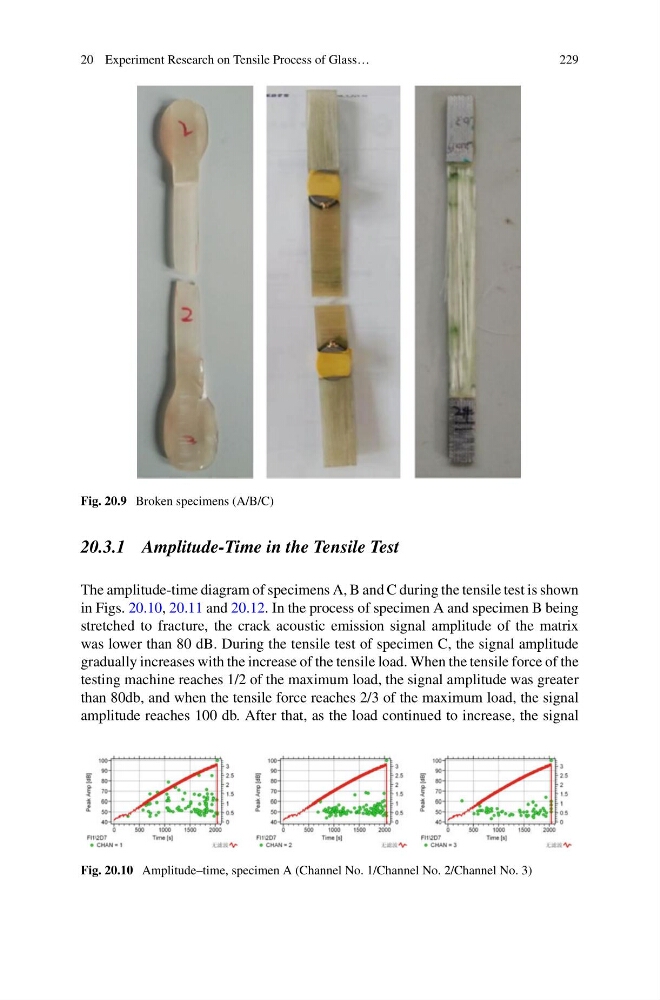
Fig. 20.9 Broken specimens (A/B/C)
20.3.1 Amplitude-Time in the Tensile Test
The amplitude-time diagram of specimens A, B and C during the tensile test is shown
in Figs. 20.10, 20.11 and 20.12. In the process of specimen A and specimen B being
stretched to fracture, the crack acoustic emission signal amplitude of the matrix
was lower than 80 dB. During the tensile test of specimen C, the signal amplitude
gradually increases with the increase of the tensile load. When the tensile force of the
testing machine reaches 1/2 of the maximum load, the signal amplitude was greater
than 80db, and when the tensile force reaches 2/3 of the maximum load, the signal
amplitude reaches 100 db. After that, as the load continued to increase, the signal
Fig. 20.10 Amplitude–time, specimen A (Channel No. 1/Channel No. 2/Channel No. 3)
229
Fig. 20.9 Broken specimens (A/B/C)
20.3.1 Amplitude-Time in the Tensile Test
The amplitude-time diagram of specimens A, B and C during the tensile test is shown
in Figs. 20.10, 20.11 and 20.12. In the process of specimen A and specimen B being
stretched to fracture, the crack acoustic emission signal amplitude of the matrix
was lower than 80 dB. During the tensile test of specimen C, the signal amplitude
gradually increases with the increase of the tensile load. When the tensile force of the
testing machine reaches 1/2 of the maximum load, the signal amplitude was greater
than 80db, and when the tensile force reaches 2/3 of the maximum load, the signal
amplitude reaches 100 db. After that, as the load continued to increase, the signal
Fig. 20.10 Amplitude–time, specimen A (Channel No. 1/Channel No. 2/Channel No. 3)