

218
W. Zhang et al.
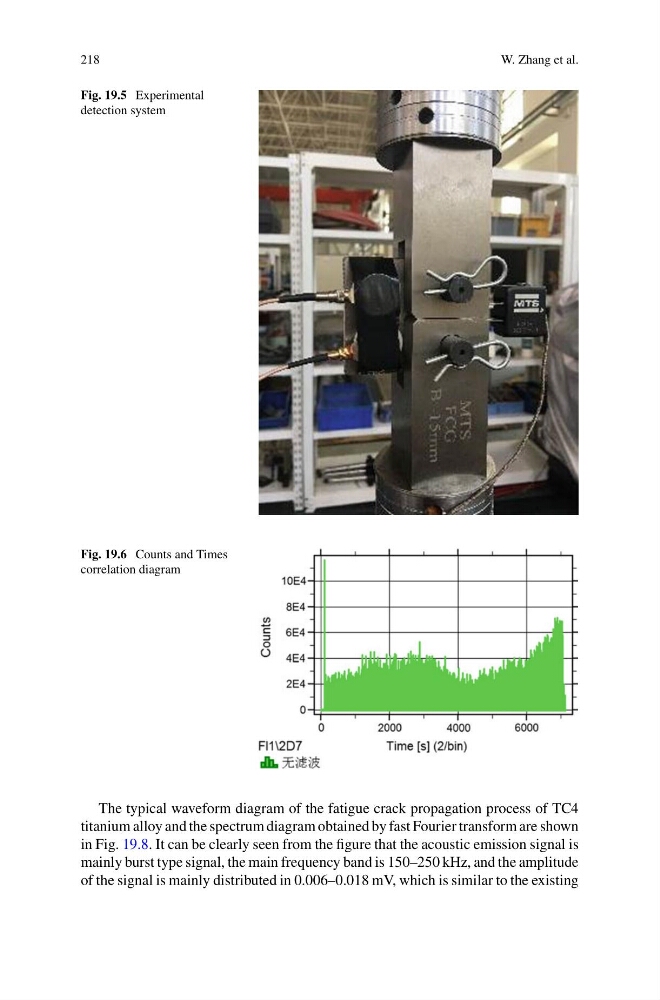
Fig. 19.5 Experimental
detection system
Fig. 19.6 Counts and Times
correlation diagram
The typical waveform diagram of the fatigue crack propagation process of TC4
titanium alloy and the spectrum diagram obtained by fast Fourier transform are shown
in Fig. 19.8. It can be clearly seen from the figure that the acoustic emission signal is
mainly burst type signal, the main frequency band is 150–250 kHz, and the amplitude
of the signal is mainly distributed in 0.006–0.018 mV, which is similar to the existing
W. Zhang et al.
Fig. 19.5 Experimental
detection system
Fig. 19.6 Counts and Times
correlation diagram
The typical waveform diagram of the fatigue crack propagation process of TC4
titanium alloy and the spectrum diagram obtained by fast Fourier transform are shown
in Fig. 19.8. It can be clearly seen from the figure that the acoustic emission signal is
mainly burst type signal, the main frequency band is 150–250 kHz, and the amplitude
of the signal is mainly distributed in 0.006–0.018 mV, which is similar to the existing