

19 Fatigue Crack Growth of TC4 Titanium Alloy …
217
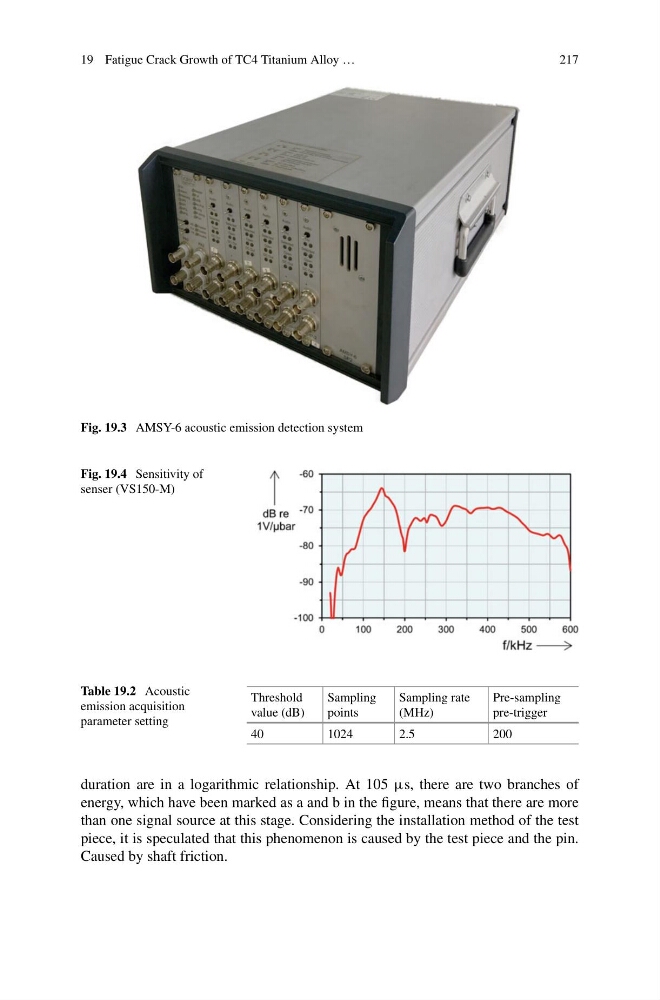
Fig. 19.3 AMSY-6 acoustic emission detection system
Fig. 19.4 Sensitivity of
senser (VS150-M)
Table 19.2 Acoustic
emission acquisition
parameter setting
Threshold
value (dB)
Sampling
points
Sampling rate
(MHz)
Pre-sampling
pre-trigger
40
1024
2.5
200
duration are in a logarithmic relationship. At 105 µs, there are two branches of
energy, which have been marked as a and b in the figure, means that there are more
than one signal source at this stage. Considering the installation method of the test
piece, it is speculated that this phenomenon is caused by the test piece and the pin.
Caused by shaft friction.
217
Fig. 19.3 AMSY-6 acoustic emission detection system
Fig. 19.4 Sensitivity of
senser (VS150-M)
Table 19.2 Acoustic
emission acquisition
parameter setting
Threshold
value (dB)
Sampling
points
Sampling rate
(MHz)
Pre-sampling
pre-trigger
40
1024
2.5
200
duration are in a logarithmic relationship. At 105 µs, there are two branches of
energy, which have been marked as a and b in the figure, means that there are more
than one signal source at this stage. Considering the installation method of the test
piece, it is speculated that this phenomenon is caused by the test piece and the pin.
Caused by shaft friction.