

216
W. Zhang et al.
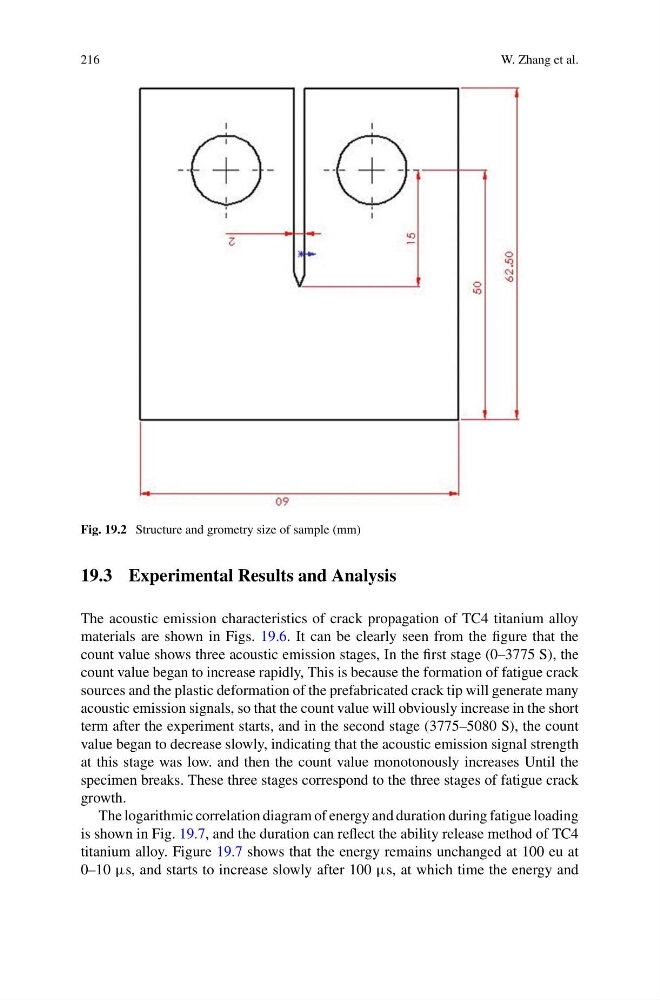
Fig. 19.2 Structure and grometry size of sample (mm)
19.3 Experimental Results and Analysis
The acoustic emission characteristics of crack propagation of TC4 titanium alloy
materials are shown in Figs. 19.6. It can be clearly seen from the figure that the
count value shows three acoustic emission stages, In the first stage (0–3775 S), the
count value began to increase rapidly, This is because the formation of fatigue crack
sources and the plastic deformation of the prefabricated crack tip will generate many
acoustic emission signals, so that the count value will obviously increase in the short
term after the experiment starts, and in the second stage (3775–5080 S), the count
value began to decrease slowly, indicating that the acoustic emission signal strength
at this stage was low. and then the count value monotonously increases Until the
specimen breaks. These three stages correspond to the three stages of fatigue crack
growth.
The logarithmic correlation diagram of energy and duration during fatigue loading
is shown in Fig. 19.7, and the duration can reflect the ability release method of TC4
titanium alloy. Figure 19.7 shows that the energy remains unchanged at 100 eu at
0–10 µs, and starts to increase slowly after 100 µs, at which time the energy and
W. Zhang et al.
Fig. 19.2 Structure and grometry size of sample (mm)
19.3 Experimental Results and Analysis
The acoustic emission characteristics of crack propagation of TC4 titanium alloy
materials are shown in Figs. 19.6. It can be clearly seen from the figure that the
count value shows three acoustic emission stages, In the first stage (0–3775 S), the
count value began to increase rapidly, This is because the formation of fatigue crack
sources and the plastic deformation of the prefabricated crack tip will generate many
acoustic emission signals, so that the count value will obviously increase in the short
term after the experiment starts, and in the second stage (3775–5080 S), the count
value began to decrease slowly, indicating that the acoustic emission signal strength
at this stage was low. and then the count value monotonously increases Until the
specimen breaks. These three stages correspond to the three stages of fatigue crack
growth.
The logarithmic correlation diagram of energy and duration during fatigue loading
is shown in Fig. 19.7, and the duration can reflect the ability release method of TC4
titanium alloy. Figure 19.7 shows that the energy remains unchanged at 100 eu at
0–10 µs, and starts to increase slowly after 100 µs, at which time the energy and