

208
W. Zhou et al.
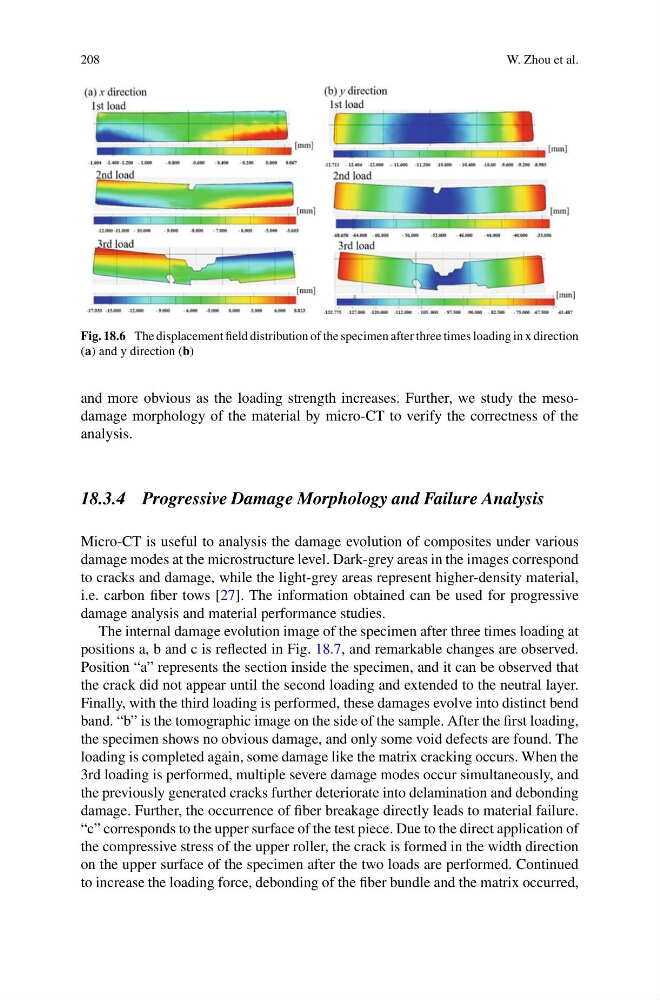
Fig. 18.6 The displacement field distribution of the specimen after three times loading in x direction
(a) and y direction (b)
and more obvious as the loading strength increases. Further, we study the mesodamage morphology of the material by micro-CT to verify the correctness of the
analysis.
18.3.4 Progressive Damage Morphology and Failure Analysis
Micro-CT is useful to analysis the damage evolution of composites under various
damage modes at the microstructure level. Dark-grey areas in the images correspond
to cracks and damage, while the light-grey areas represent higher-density material,
i.e. carbon fiber tows [27]. The information obtained can be used for progressive
damage analysis and material performance studies.
The internal damage evolution image of the specimen after three times loading at
positions a, b and c is reflected in Fig. 18.7, and remarkable changes are observed.
Position “a” represents the section inside the specimen, and it can be observed that
the crack did not appear until the second loading and extended to the neutral layer.
Finally, with the third loading is performed, these damages evolve into distinct bend
band. “b” is the tomographic image on the side of the sample. After the first loading,
the specimen shows no obvious damage, and only some void defects are found. The
loading is completed again, some damage like the matrix cracking occurs. When the
3rd loading is performed, multiple severe damage modes occur simultaneously, and
the previously generated cracks further deteriorate into delamination and debonding
damage. Further, the occurrence of fiber breakage directly leads to material failure.
“c” corresponds to the upper surface of the test piece. Due to the direct application of
the compressive stress of the upper roller, the crack is formed in the width direction
on the upper surface of the specimen after the two loads are performed. Continued
to increase the loading force, debonding of the fiber bundle and the matrix occurred,
W. Zhou et al.
Fig. 18.6 The displacement field distribution of the specimen after three times loading in x direction
(a) and y direction (b)
and more obvious as the loading strength increases. Further, we study the mesodamage morphology of the material by micro-CT to verify the correctness of the
analysis.
18.3.4 Progressive Damage Morphology and Failure Analysis
Micro-CT is useful to analysis the damage evolution of composites under various
damage modes at the microstructure level. Dark-grey areas in the images correspond
to cracks and damage, while the light-grey areas represent higher-density material,
i.e. carbon fiber tows [27]. The information obtained can be used for progressive
damage analysis and material performance studies.
The internal damage evolution image of the specimen after three times loading at
positions a, b and c is reflected in Fig. 18.7, and remarkable changes are observed.
Position “a” represents the section inside the specimen, and it can be observed that
the crack did not appear until the second loading and extended to the neutral layer.
Finally, with the third loading is performed, these damages evolve into distinct bend
band. “b” is the tomographic image on the side of the sample. After the first loading,
the specimen shows no obvious damage, and only some void defects are found. The
loading is completed again, some damage like the matrix cracking occurs. When the
3rd loading is performed, multiple severe damage modes occur simultaneously, and
the previously generated cracks further deteriorate into delamination and debonding
damage. Further, the occurrence of fiber breakage directly leads to material failure.
“c” corresponds to the upper surface of the test piece. Due to the direct application of
the compressive stress of the upper roller, the crack is formed in the width direction
on the upper surface of the specimen after the two loads are performed. Continued
to increase the loading force, debonding of the fiber bundle and the matrix occurred,