

Tailoring the Surface Functionalities of Titania …
519
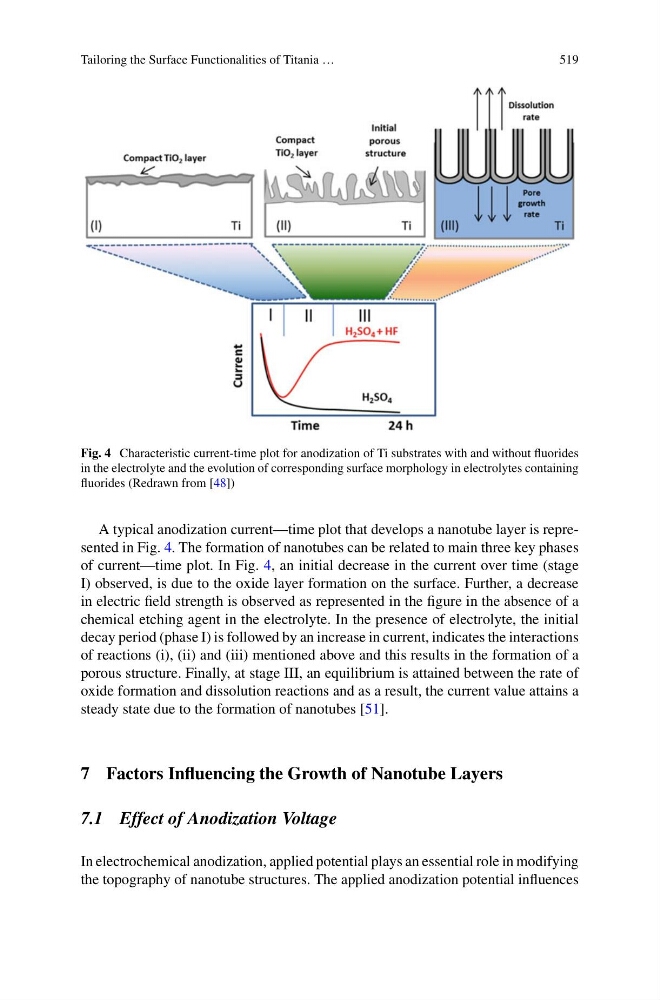
Fig. 4 Characteristic current-time plot for anodization of Ti substrates with and without fluorides
in the electrolyte and the evolution of corresponding surface morphology in electrolytes containing
fluorides (Redrawn from [48])
A typical anodization current—time plot that develops a nanotube layer is represented in Fig. 4. The formation of nanotubes can be related to main three key phases
of current—time plot. In Fig. 4, an initial decrease in the current over time (stage
I) observed, is due to the oxide layer formation on the surface. Further, a decrease
in electric field strength is observed as represented in the figure in the absence of a
chemical etching agent in the electrolyte. In the presence of electrolyte, the initial
decay period (phase I) is followed by an increase in current, indicates the interactions
of reactions (i), (ii) and (iii) mentioned above and this results in the formation of a
porous structure. Finally, at stage III, an equilibrium is attained between the rate of
oxide formation and dissolution reactions and as a result, the current value attains a
steady state due to the formation of nanotubes [51].
7 Factors Influencing the Growth of Nanotube Layers
7.1 Effect of Anodization Voltage
In electrochemical anodization, applied potential plays an essential role in modifying
the topography of nanotube structures. The applied anodization potential influences
519
Fig. 4 Characteristic current-time plot for anodization of Ti substrates with and without fluorides
in the electrolyte and the evolution of corresponding surface morphology in electrolytes containing
fluorides (Redrawn from [48])
A typical anodization current—time plot that develops a nanotube layer is represented in Fig. 4. The formation of nanotubes can be related to main three key phases
of current—time plot. In Fig. 4, an initial decrease in the current over time (stage
I) observed, is due to the oxide layer formation on the surface. Further, a decrease
in electric field strength is observed as represented in the figure in the absence of a
chemical etching agent in the electrolyte. In the presence of electrolyte, the initial
decay period (phase I) is followed by an increase in current, indicates the interactions
of reactions (i), (ii) and (iii) mentioned above and this results in the formation of a
porous structure. Finally, at stage III, an equilibrium is attained between the rate of
oxide formation and dissolution reactions and as a result, the current value attains a
steady state due to the formation of nanotubes [51].
7 Factors Influencing the Growth of Nanotube Layers
7.1 Effect of Anodization Voltage
In electrochemical anodization, applied potential plays an essential role in modifying
the topography of nanotube structures. The applied anodization potential influences