

472
T. Balusamy et al.
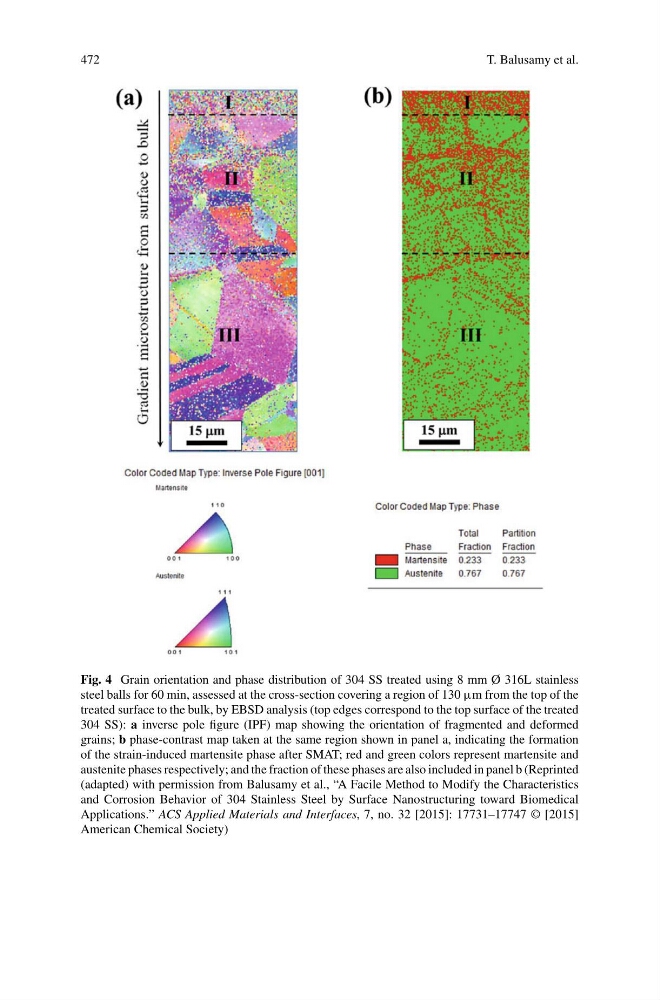
Fig. 4 Grain orientation and phase distribution of 304 SS treated using 8 mm Ø 316L stainless
steel balls for 60 min, assessed at the cross-section covering a region of 130 μm from the top of the
treated surface to the bulk, by EBSD analysis (top edges correspond to the top surface of the treated
304 SS): a inverse pole figure (IPF) map showing the orientation of fragmented and deformed
grains; b phase-contrast map taken at the same region shown in panel a, indicating the formation
of the strain-induced martensite phase after SMAT; red and green colors represent martensite and
austenite phases respectively; and the fraction of these phases are also included in panel b (Reprinted
(adapted) with permission from Balusamy et al., “A Facile Method to Modify the Characteristics
and Corrosion Behavior of 304 Stainless Steel by Surface Nanostructuring toward Biomedical
Applications.” ACS Applied Materials and Interfaces, 7, no. 32 [2015]: 17731–17747 © [2015]
American Chemical Society)
T. Balusamy et al.
Fig. 4 Grain orientation and phase distribution of 304 SS treated using 8 mm Ø 316L stainless
steel balls for 60 min, assessed at the cross-section covering a region of 130 μm from the top of the
treated surface to the bulk, by EBSD analysis (top edges correspond to the top surface of the treated
304 SS): a inverse pole figure (IPF) map showing the orientation of fragmented and deformed
grains; b phase-contrast map taken at the same region shown in panel a, indicating the formation
of the strain-induced martensite phase after SMAT; red and green colors represent martensite and
austenite phases respectively; and the fraction of these phases are also included in panel b (Reprinted
(adapted) with permission from Balusamy et al., “A Facile Method to Modify the Characteristics
and Corrosion Behavior of 304 Stainless Steel by Surface Nanostructuring toward Biomedical
Applications.” ACS Applied Materials and Interfaces, 7, no. 32 [2015]: 17731–17747 © [2015]
American Chemical Society)