

Surface Nanostructuring of Metallic Materials …
471
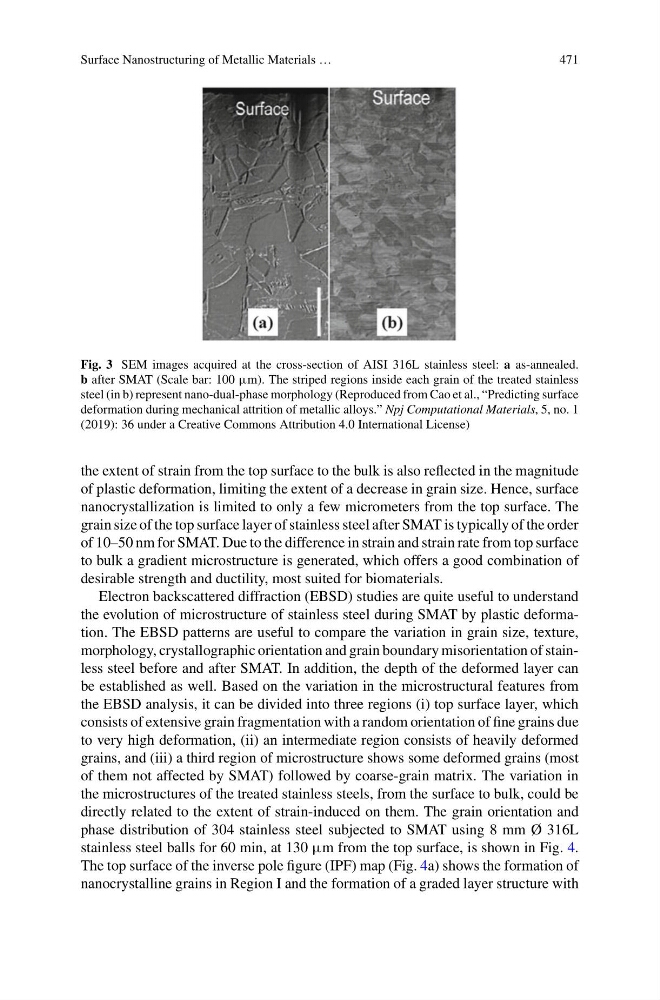
Fig. 3 SEM images acquired at the cross-section of AISI 316L stainless steel: a as-annealed.
b after SMAT (Scale bar: 100 μm). The striped regions inside each grain of the treated stainless
steel (in b) represent nano-dual-phase morphology (Reproduced from Cao et al., “Predicting surface
deformation during mechanical attrition of metallic alloys.” Npj Computational Materials, 5, no. 1
(2019): 36 under a Creative Commons Attribution 4.0 International License)
the extent of strain from the top surface to the bulk is also reflected in the magnitude
of plastic deformation, limiting the extent of a decrease in grain size. Hence, surface
nanocrystallization is limited to only a few micrometers from the top surface. The
grain size of the top surface layer of stainless steel after SMAT is typically of the order
of 10–50 nm for SMAT. Due to the difference in strain and strain rate from top surface
to bulk a gradient microstructure is generated, which offers a good combination of
desirable strength and ductility, most suited for biomaterials.
Electron backscattered diffraction (EBSD) studies are quite useful to understand
the evolution of microstructure of stainless steel during SMAT by plastic deformation. The EBSD patterns are useful to compare the variation in grain size, texture,
morphology, crystallographic orientation and grain boundary misorientation of stainless steel before and after SMAT. In addition, the depth of the deformed layer can
be established as well. Based on the variation in the microstructural features from
the EBSD analysis, it can be divided into three regions (i) top surface layer, which
consists of extensive grain fragmentation with a random orientation of fine grains due
to very high deformation, (ii) an intermediate region consists of heavily deformed
grains, and (iii) a third region of microstructure shows some deformed grains (most
of them not affected by SMAT) followed by coarse-grain matrix. The variation in
the microstructures of the treated stainless steels, from the surface to bulk, could be
directly related to the extent of strain-induced on them. The grain orientation and
phase distribution of 304 stainless steel subjected to SMAT using 8 mm Ø 316L
stainless steel balls for 60 min, at 130 μm from the top surface, is shown in Fig. 4.
The top surface of the inverse pole figure (IPF) map (Fig. 4a) shows the formation of
nanocrystalline grains in Region I and the formation of a graded layer structure with
471
Fig. 3 SEM images acquired at the cross-section of AISI 316L stainless steel: a as-annealed.
b after SMAT (Scale bar: 100 μm). The striped regions inside each grain of the treated stainless
steel (in b) represent nano-dual-phase morphology (Reproduced from Cao et al., “Predicting surface
deformation during mechanical attrition of metallic alloys.” Npj Computational Materials, 5, no. 1
(2019): 36 under a Creative Commons Attribution 4.0 International License)
the extent of strain from the top surface to the bulk is also reflected in the magnitude
of plastic deformation, limiting the extent of a decrease in grain size. Hence, surface
nanocrystallization is limited to only a few micrometers from the top surface. The
grain size of the top surface layer of stainless steel after SMAT is typically of the order
of 10–50 nm for SMAT. Due to the difference in strain and strain rate from top surface
to bulk a gradient microstructure is generated, which offers a good combination of
desirable strength and ductility, most suited for biomaterials.
Electron backscattered diffraction (EBSD) studies are quite useful to understand
the evolution of microstructure of stainless steel during SMAT by plastic deformation. The EBSD patterns are useful to compare the variation in grain size, texture,
morphology, crystallographic orientation and grain boundary misorientation of stainless steel before and after SMAT. In addition, the depth of the deformed layer can
be established as well. Based on the variation in the microstructural features from
the EBSD analysis, it can be divided into three regions (i) top surface layer, which
consists of extensive grain fragmentation with a random orientation of fine grains due
to very high deformation, (ii) an intermediate region consists of heavily deformed
grains, and (iii) a third region of microstructure shows some deformed grains (most
of them not affected by SMAT) followed by coarse-grain matrix. The variation in
the microstructures of the treated stainless steels, from the surface to bulk, could be
directly related to the extent of strain-induced on them. The grain orientation and
phase distribution of 304 stainless steel subjected to SMAT using 8 mm Ø 316L
stainless steel balls for 60 min, at 130 μm from the top surface, is shown in Fig. 4.
The top surface of the inverse pole figure (IPF) map (Fig. 4a) shows the formation of
nanocrystalline grains in Region I and the formation of a graded layer structure with