

270
8 Manifestations of Chaos in Quantum Scattering Processes
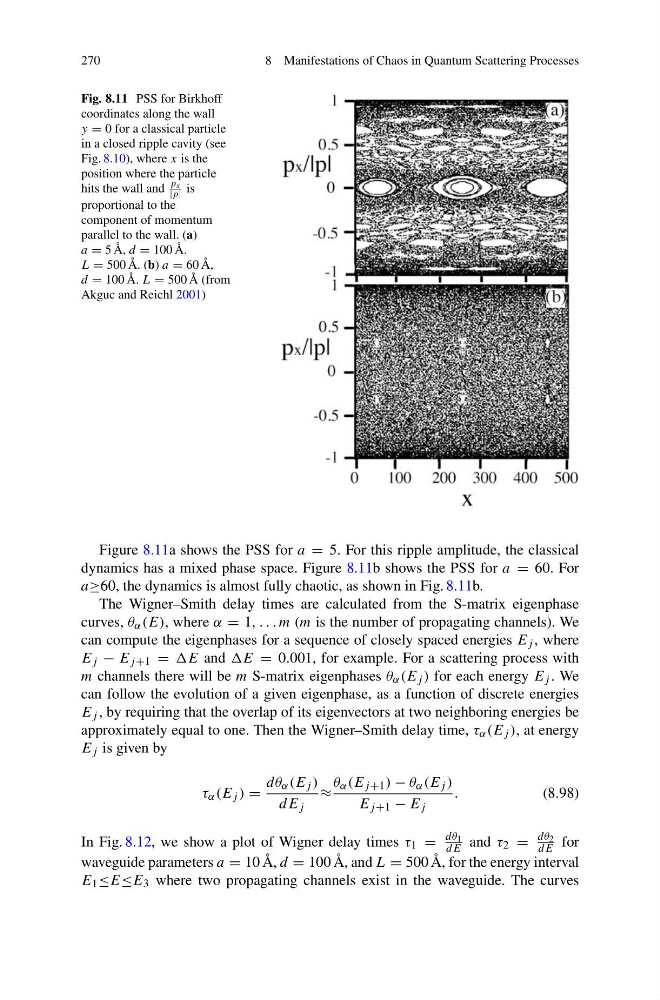
Fig. 8.11 PSS for Birkhoff
coordinates along the wall
y = 0 for a classical particle
in a closed ripple cavity (see
Fig. 8.10), where x is the
position where the particle
hits the wall and
px
|p| is
proportional to the
component of momentum
parallel to the wall. (a)
a = 5 Å, d = 100 Å.
L = 500 Å. (b) a = 60 Å,
d = 100 Å. L = 500 Å (from
Akguc and Reichl 2001)
Figure 8.11a shows the PSS for a = 5. For this ripple amplitude, the classical
dynamics has a mixed phase space. Figure 8.11b shows the PSS for a = 60. For
a≥60, the dynamics is almost fully chaotic, as shown in Fig. 8.11b.
The Wigner–Smith delay times are calculated from the S-matrix eigenphase
curves, θ α (E), where α = 1, . . . m (m is the number of propagating channels). We
can compute the eigenphases for a sequence of closely spaced energies E j , where
E j − E j +1 = E and = 0.001, for example. For a scattering process with
m channels there will be m S-matrix eigenphases θ α (E j ) for each energy E j . We
can follow the evolution of a given eigenphase, as a function of discrete energies
E j , by requiring that the overlap of its eigenvectors at two neighboring energies be
approximately equal to one. Then the Wigner–Smith delay time, τ α (E j ), at energy
E j is given by
τ α (E j ) =
dθ α (E j )
dE j
≈
θ α (E j +1 ) − θ α (E j )
E j +1 − E j
.
(8.98)
In Fig. 8.12, we show a plot of Wigner delay times τ 1 =
dθ 1
dE and τ 2 =
dθ 2
dE for
waveguide parameters a = 10 Å, d = 100 Å, and L = 500 Å, for the energy interval
E 1 ≤E≤E 3 where two propagating channels exist in the waveguide. The curves
8 Manifestations of Chaos in Quantum Scattering Processes
Fig. 8.11 PSS for Birkhoff
coordinates along the wall
y = 0 for a classical particle
in a closed ripple cavity (see
Fig. 8.10), where x is the
position where the particle
hits the wall and
px
|p| is
proportional to the
component of momentum
parallel to the wall. (a)
a = 5 Å, d = 100 Å.
L = 500 Å. (b) a = 60 Å,
d = 100 Å. L = 500 Å (from
Akguc and Reichl 2001)
Figure 8.11a shows the PSS for a = 5. For this ripple amplitude, the classical
dynamics has a mixed phase space. Figure 8.11b shows the PSS for a = 60. For
a≥60, the dynamics is almost fully chaotic, as shown in Fig. 8.11b.
The Wigner–Smith delay times are calculated from the S-matrix eigenphase
curves, θ α (E), where α = 1, . . . m (m is the number of propagating channels). We
can compute the eigenphases for a sequence of closely spaced energies E j , where
E j − E j +1 = E and = 0.001, for example. For a scattering process with
m channels there will be m S-matrix eigenphases θ α (E j ) for each energy E j . We
can follow the evolution of a given eigenphase, as a function of discrete energies
E j , by requiring that the overlap of its eigenvectors at two neighboring energies be
approximately equal to one. Then the Wigner–Smith delay time, τ α (E j ), at energy
E j is given by
τ α (E j ) =
dθ α (E j )
dE j
≈
θ α (E j +1 ) − θ α (E j )
E j +1 − E j
.
(8.98)
In Fig. 8.12, we show a plot of Wigner delay times τ 1 =
dθ 1
dE and τ 2 =
dθ 2
dE for
waveguide parameters a = 10 Å, d = 100 Å, and L = 500 Å, for the energy interval
E 1 ≤E≤E 3 where two propagating channels exist in the waveguide. The curves