

7.9 Signatures of Chaos in a Soft Sinai Lattice
229
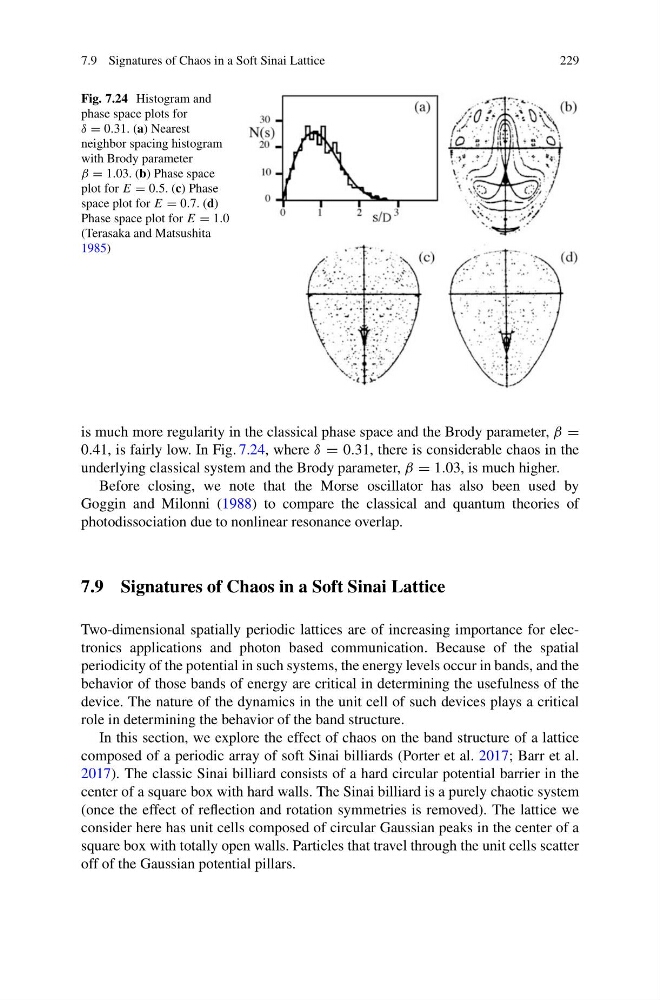
Fig. 7.24 Histogram and
phase space plots for
δ = 0.31. (a) Nearest
neighbor spacing histogram
with Brody parameter
β = 1.03. (b) Phase space
plot for E = 0.5. (c) Phase
space plot for E = 0.7. (d)
Phase space plot for E = 1.0
(Terasaka and Matsushita
1985)
is much more regularity in the classical phase space and the Brody parameter, β =
0.41, is fairly low. In Fig. 7.24, where δ = 0.31, there is considerable chaos in the
underlying classical system and the Brody parameter, β = 1.03, is much higher.
Before closing, we note that the Morse oscillator has also been used by
Goggin and Milonni (1988) to compare the classical and quantum theories of
photodissociation due to nonlinear resonance overlap.
7.9 Signatures of Chaos in a Soft Sinai Lattice
Two-dimensional spatially periodic lattices are of increasing importance for electronics applications and photon based communication. Because of the spatial
periodicity of the potential in such systems, the energy levels occur in bands, and the
behavior of those bands of energy are critical in determining the usefulness of the
device. The nature of the dynamics in the unit cell of such devices plays a critical
role in determining the behavior of the band structure.
In this section, we explore the effect of chaos on the band structure of a lattice
composed of a periodic array of soft Sinai billiards (Porter et al. 2017; Barr et al.
2017). The classic Sinai billiard consists of a hard circular potential barrier in the
center of a square box with hard walls. The Sinai billiard is a purely chaotic system
(once the effect of reflection and rotation symmetries is removed). The lattice we
consider here has unit cells composed of circular Gaussian peaks in the center of a
square box with totally open walls. Particles that travel through the unit cells scatter
off of the Gaussian potential pillars.
229
Fig. 7.24 Histogram and
phase space plots for
δ = 0.31. (a) Nearest
neighbor spacing histogram
with Brody parameter
β = 1.03. (b) Phase space
plot for E = 0.5. (c) Phase
space plot for E = 0.7. (d)
Phase space plot for E = 1.0
(Terasaka and Matsushita
1985)
is much more regularity in the classical phase space and the Brody parameter, β =
0.41, is fairly low. In Fig. 7.24, where δ = 0.31, there is considerable chaos in the
underlying classical system and the Brody parameter, β = 1.03, is much higher.
Before closing, we note that the Morse oscillator has also been used by
Goggin and Milonni (1988) to compare the classical and quantum theories of
photodissociation due to nonlinear resonance overlap.
7.9 Signatures of Chaos in a Soft Sinai Lattice
Two-dimensional spatially periodic lattices are of increasing importance for electronics applications and photon based communication. Because of the spatial
periodicity of the potential in such systems, the energy levels occur in bands, and the
behavior of those bands of energy are critical in determining the usefulness of the
device. The nature of the dynamics in the unit cell of such devices plays a critical
role in determining the behavior of the band structure.
In this section, we explore the effect of chaos on the band structure of a lattice
composed of a periodic array of soft Sinai billiards (Porter et al. 2017; Barr et al.
2017). The classic Sinai billiard consists of a hard circular potential barrier in the
center of a square box with hard walls. The Sinai billiard is a purely chaotic system
(once the effect of reflection and rotation symmetries is removed). The lattice we
consider here has unit cells composed of circular Gaussian peaks in the center of a
square box with totally open walls. Particles that travel through the unit cells scatter
off of the Gaussian potential pillars.