

228
7 Bounded Quantum Systems
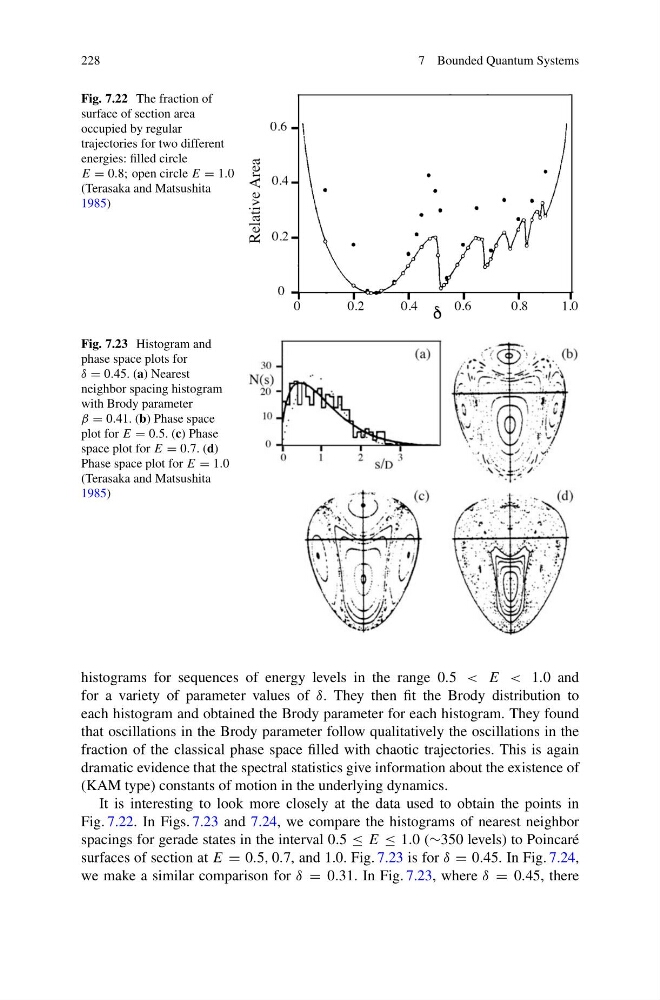
Fig. 7.22 The fraction of
surface of section area
occupied by regular
trajectories for two different
energies: filled circle
E = 0.8; open circle E = 1.0
(Terasaka and Matsushita
1985)
Fig. 7.23 Histogram and
phase space plots for
δ = 0.45. (a) Nearest
neighbor spacing histogram
with Brody parameter
β = 0.41. (b) Phase space
plot for E = 0.5. (c) Phase
space plot for E = 0.7. (d)
Phase space plot for E = 1.0
(Terasaka and Matsushita
1985)
histograms for sequences of energy levels in the range 0.5 < E < 1.0 and
for a variety of parameter values of δ. They then fit the Brody distribution to
each histogram and obtained the Brody parameter for each histogram. They found
that oscillations in the Brody parameter follow qualitatively the oscillations in the
fraction of the classical phase space filled with chaotic trajectories. This is again
dramatic evidence that the spectral statistics give information about the existence of
(KAM type) constants of motion in the underlying dynamics.
It is interesting to look more closely at the data used to obtain the points in
Fig. 7.22. In Figs. 7.23 and 7.24, we compare the histograms of nearest neighbor
spacings for gerade states in the interval 0.5 ≤ E ≤ 1.0 (∼350 levels) to Poincaré
surfaces of section at E = 0.5, 0.7, and 1.0. Fig. 7.23 is for δ = 0.45. In Fig. 7.24,
we make a similar comparison for δ = 0.31. In Fig. 7.23, where δ = 0.45, there
7 Bounded Quantum Systems
Fig. 7.22 The fraction of
surface of section area
occupied by regular
trajectories for two different
energies: filled circle
E = 0.8; open circle E = 1.0
(Terasaka and Matsushita
1985)
Fig. 7.23 Histogram and
phase space plots for
δ = 0.45. (a) Nearest
neighbor spacing histogram
with Brody parameter
β = 0.41. (b) Phase space
plot for E = 0.5. (c) Phase
space plot for E = 0.7. (d)
Phase space plot for E = 1.0
(Terasaka and Matsushita
1985)
histograms for sequences of energy levels in the range 0.5 < E < 1.0 and
for a variety of parameter values of δ. They then fit the Brody distribution to
each histogram and obtained the Brody parameter for each histogram. They found
that oscillations in the Brody parameter follow qualitatively the oscillations in the
fraction of the classical phase space filled with chaotic trajectories. This is again
dramatic evidence that the spectral statistics give information about the existence of
(KAM type) constants of motion in the underlying dynamics.
It is interesting to look more closely at the data used to obtain the points in
Fig. 7.22. In Figs. 7.23 and 7.24, we compare the histograms of nearest neighbor
spacings for gerade states in the interval 0.5 ≤ E ≤ 1.0 (∼350 levels) to Poincaré
surfaces of section at E = 0.5, 0.7, and 1.0. Fig. 7.23 is for δ = 0.45. In Fig. 7.24,
we make a similar comparison for δ = 0.31. In Fig. 7.23, where δ = 0.45, there