

7.8 Coupled Morse Oscillators
227
7.8 Coupled Morse Oscillators
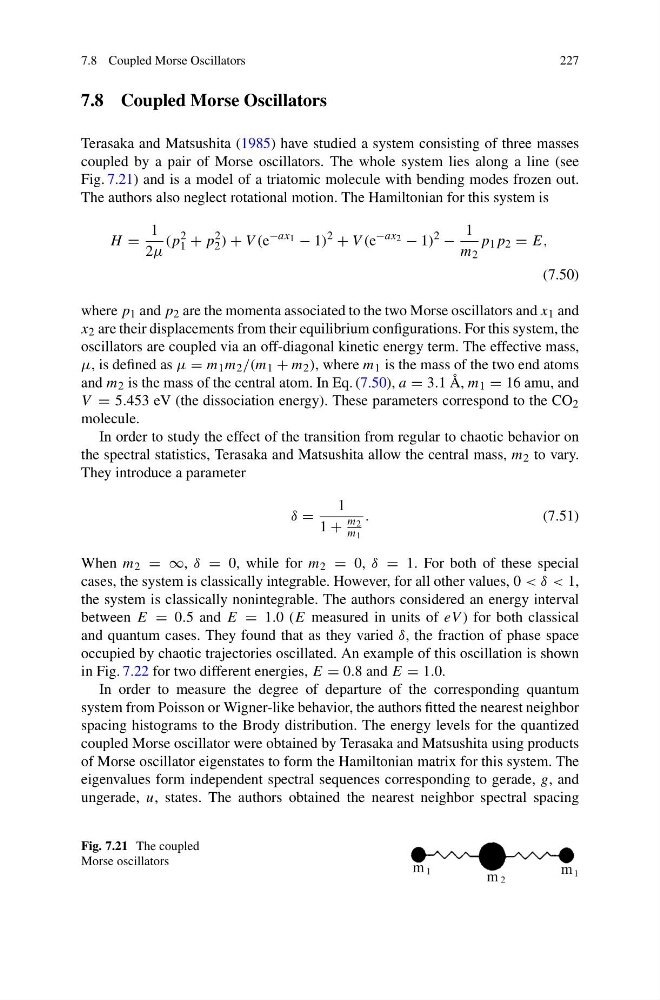
Terasaka and Matsushita (1985) have studied a system consisting of three masses
coupled by a pair of Morse oscillators. The whole system lies along a line (see
Fig. 7.21) and is a model of a triatomic molecule with bending modes frozen out.
The authors also neglect rotational motion. The Hamiltonian for this system is
H =
1
2μ
(p
2
1 + p
2
2 ) + V (e
−ax 1 − 1)
2
+ V (e
−ax 2 − 1)
2
−
1
m 2
p 1 p 2 = E,
(7.50)
where p 1 and p 2 are the momenta associated to the two Morse oscillators and x 1 and
x 2 are their displacements from their equilibrium configurations. For this system, the
oscillators are coupled via an off-diagonal kinetic energy term. The effective mass,
μ, is defined as μ = m 1 m 2 /(m 1 + m 2 ), where m 1 is the mass of the two end atoms
and m 2 is the mass of the central atom. In Eq. (7.50), a = 3.1 Å, m 1 = 16 amu, and
V = 5.453 eV (the dissociation energy). These parameters correspond to the CO 2
molecule.
In order to study the effect of the transition from regular to chaotic behavior on
the spectral statistics, Terasaka and Matsushita allow the central mass, m 2 to vary.
They introduce a parameter
δ =
1
1 +
m 2
m 1
.
(7.51)
When m 2 = ∞, δ = 0, while for m 2 = 0, δ = 1. For both of these special
cases, the system is classically integrable. However, for all other values, 0 < δ < 1,
the system is classically nonintegrable. The authors considered an energy interval
between E = 0.5 and E = 1.0 (E measured in units of eV ) for both classical
and quantum cases. They found that as they varied δ, the fraction of phase space
occupied by chaotic trajectories oscillated. An example of this oscillation is shown
in Fig. 7.22 for two different energies, E = 0.8 and E = 1.0.
In order to measure the degree of departure of the corresponding quantum
system from Poisson or Wigner-like behavior, the authors fitted the nearest neighbor
spacing histograms to the Brody distribution. The energy levels for the quantized
coupled Morse oscillator were obtained by Terasaka and Matsushita using products
of Morse oscillator eigenstates to form the Hamiltonian matrix for this system. The
eigenvalues form independent spectral sequences corresponding to gerade, g, and
ungerade, u, states. The authors obtained the nearest neighbor spectral spacing
Fig. 7.21 The coupled
Morse oscillators
227
7.8 Coupled Morse Oscillators
Terasaka and Matsushita (1985) have studied a system consisting of three masses
coupled by a pair of Morse oscillators. The whole system lies along a line (see
Fig. 7.21) and is a model of a triatomic molecule with bending modes frozen out.
The authors also neglect rotational motion. The Hamiltonian for this system is
H =
1
2μ
(p
2
1 + p
2
2 ) + V (e
−ax 1 − 1)
2
+ V (e
−ax 2 − 1)
2
−
1
m 2
p 1 p 2 = E,
(7.50)
where p 1 and p 2 are the momenta associated to the two Morse oscillators and x 1 and
x 2 are their displacements from their equilibrium configurations. For this system, the
oscillators are coupled via an off-diagonal kinetic energy term. The effective mass,
μ, is defined as μ = m 1 m 2 /(m 1 + m 2 ), where m 1 is the mass of the two end atoms
and m 2 is the mass of the central atom. In Eq. (7.50), a = 3.1 Å, m 1 = 16 amu, and
V = 5.453 eV (the dissociation energy). These parameters correspond to the CO 2
molecule.
In order to study the effect of the transition from regular to chaotic behavior on
the spectral statistics, Terasaka and Matsushita allow the central mass, m 2 to vary.
They introduce a parameter
δ =
1
1 +
m 2
m 1
.
(7.51)
When m 2 = ∞, δ = 0, while for m 2 = 0, δ = 1. For both of these special
cases, the system is classically integrable. However, for all other values, 0 < δ < 1,
the system is classically nonintegrable. The authors considered an energy interval
between E = 0.5 and E = 1.0 (E measured in units of eV ) for both classical
and quantum cases. They found that as they varied δ, the fraction of phase space
occupied by chaotic trajectories oscillated. An example of this oscillation is shown
in Fig. 7.22 for two different energies, E = 0.8 and E = 1.0.
In order to measure the degree of departure of the corresponding quantum
system from Poisson or Wigner-like behavior, the authors fitted the nearest neighbor
spacing histograms to the Brody distribution. The energy levels for the quantized
coupled Morse oscillator were obtained by Terasaka and Matsushita using products
of Morse oscillator eigenstates to form the Hamiltonian matrix for this system. The
eigenvalues form independent spectral sequences corresponding to gerade, g, and
ungerade, u, states. The authors obtained the nearest neighbor spectral spacing
Fig. 7.21 The coupled
Morse oscillators