

214
7 Bounded Quantum Systems
Scars occur only on a small fraction of the eigenstates and, therefore, the
mechanisms leading to the creation of scars continue to be of great interest.
A considerable amount of work has been devoted to understanding and predicting
which periodic orbits of a given system might generate scarred eigenstates (see, for
example, Simonotti et al. 1997 for further discussion concerning scars on stadium
energy eigenstates). Most of the analysis of scars is based on semiclassical analysis
(Heller 1984; Bogomolny 1988; Berry 1989; Berry and Keating 1992; Agam and
Fishman 1993, 1994; Fishman et al. 1996; Klakow and Smilansky 1996; Kaplan
and Heller 1998, 2000).
7.5.2 The Sinai Billiard
The Sinai billiard was the first classical mechanical system proven to be ergodic
(Sinai 1968a,b, 1970; Bunimovich and Sinai 1980a,b, 1986; Cornfeld et al. 1982)
and, as a result, it has played a special role in classical mechanics. It continues to be
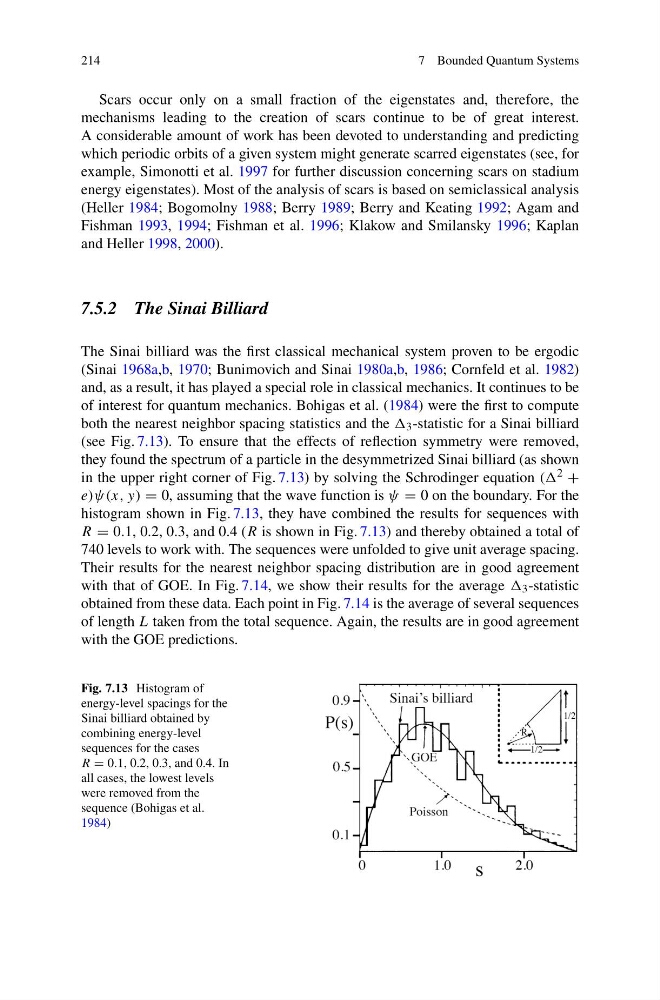
of interest for quantum mechanics. Bohigas et al. (1984) were the first to compute
both the nearest neighbor spacing statistics and the 3 -statistic for a Sinai billiard
(see Fig. 7.13). To ensure that the effects of reflection symmetry were removed,
they found the spectrum of a particle in the desymmetrized Sinai billiard (as shown
in the upper right corner of Fig. 7.13) by solving the Schrodinger equation (( 2 +
e)ψ(x, y) = 0, assuming that the wave function is ψ = 0 on the boundary. For the
histogram shown in Fig. 7.13, they have combined the results for sequences with
R = 0.1, 0.2, 0.3, and 0.4 (R is shown in Fig. 7.13) and thereby obtained a total of
740 levels to work with. The sequences were unfolded to give unit average spacing.
Their results for the nearest neighbor spacing distribution are in good agreement
with that of GOE. In Fig. 7.14, we show their results for the average 3 -statistic
obtained from these data. Each point in Fig. 7.14 is the average of several sequences
of length L taken from the total sequence. Again, the results are in good agreement
with the GOE predictions.
Fig. 7.13 Histogram of
energy-level spacings for the
Sinai billiard obtained by
combining energy-level
sequences for the cases
R = 0.1, 0.2, 0.3, and 0.4. In
all cases, the lowest levels
were removed from the
sequence (Bohigas et al.
1984)
7 Bounded Quantum Systems
Scars occur only on a small fraction of the eigenstates and, therefore, the
mechanisms leading to the creation of scars continue to be of great interest.
A considerable amount of work has been devoted to understanding and predicting
which periodic orbits of a given system might generate scarred eigenstates (see, for
example, Simonotti et al. 1997 for further discussion concerning scars on stadium
energy eigenstates). Most of the analysis of scars is based on semiclassical analysis
(Heller 1984; Bogomolny 1988; Berry 1989; Berry and Keating 1992; Agam and
Fishman 1993, 1994; Fishman et al. 1996; Klakow and Smilansky 1996; Kaplan
and Heller 1998, 2000).
7.5.2 The Sinai Billiard
The Sinai billiard was the first classical mechanical system proven to be ergodic
(Sinai 1968a,b, 1970; Bunimovich and Sinai 1980a,b, 1986; Cornfeld et al. 1982)
and, as a result, it has played a special role in classical mechanics. It continues to be
of interest for quantum mechanics. Bohigas et al. (1984) were the first to compute
both the nearest neighbor spacing statistics and the 3 -statistic for a Sinai billiard
(see Fig. 7.13). To ensure that the effects of reflection symmetry were removed,
they found the spectrum of a particle in the desymmetrized Sinai billiard (as shown
in the upper right corner of Fig. 7.13) by solving the Schrodinger equation (( 2 +
e)ψ(x, y) = 0, assuming that the wave function is ψ = 0 on the boundary. For the
histogram shown in Fig. 7.13, they have combined the results for sequences with
R = 0.1, 0.2, 0.3, and 0.4 (R is shown in Fig. 7.13) and thereby obtained a total of
740 levels to work with. The sequences were unfolded to give unit average spacing.
Their results for the nearest neighbor spacing distribution are in good agreement
with that of GOE. In Fig. 7.14, we show their results for the average 3 -statistic
obtained from these data. Each point in Fig. 7.14 is the average of several sequences
of length L taken from the total sequence. Again, the results are in good agreement
with the GOE predictions.
Fig. 7.13 Histogram of
energy-level spacings for the
Sinai billiard obtained by
combining energy-level
sequences for the cases
R = 0.1, 0.2, 0.3, and 0.4. In
all cases, the lowest levels
were removed from the
sequence (Bohigas et al.
1984)