

7.5 Quantum Billiards
213
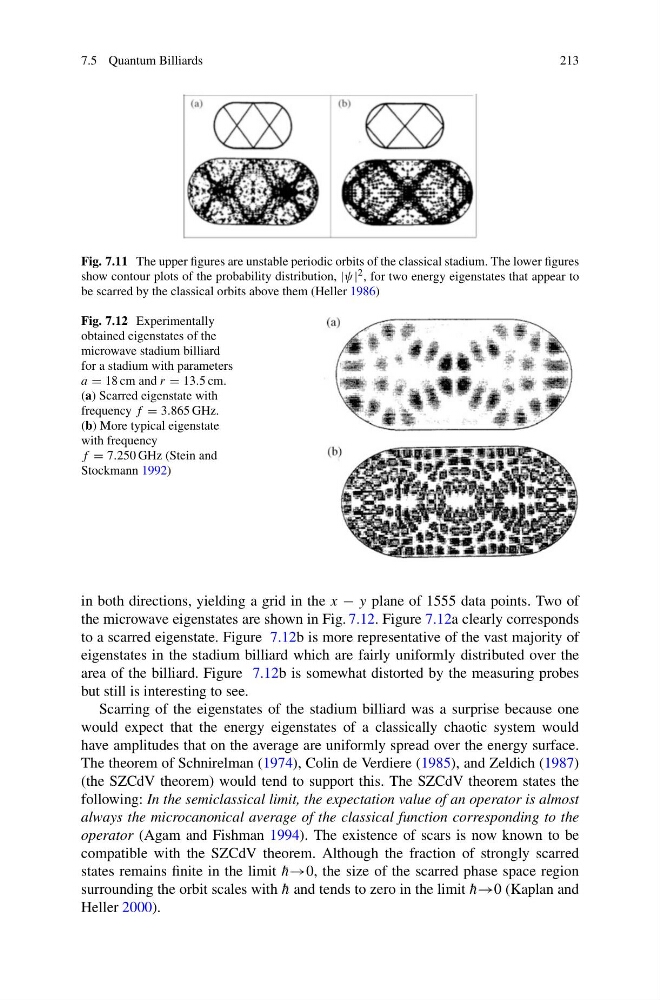
Fig. 7.11 The upper figures are unstable periodic orbits of the classical stadium. The lower figures
show contour plots of the probability distribution, |ψ| 2 , for two energy eigenstates that appear to
be scarred by the classical orbits above them (Heller 1986)
Fig. 7.12 Experimentally
obtained eigenstates of the
microwave stadium billiard
for a stadium with parameters
a = 18 cm and r = 13.5 cm.
(a) Scarred eigenstate with
frequency f = 3.865 GHz.
(b) More typical eigenstate
with frequency
f = 7.250 GHz (Stein and
Stockmann 1992)
in both directions, yielding a grid in the x − y plane of 1555 data points. Two of
the microwave eigenstates are shown in Fig. 7.12. Figure 7.12a clearly corresponds
to a scarred eigenstate. Figure 7.12b is more representative of the vast majority of
eigenstates in the stadium billiard which are fairly uniformly distributed over the
area of the billiard. Figure 7.12b is somewhat distorted by the measuring probes
but still is interesting to see.
Scarring of the eigenstates of the stadium billiard was a surprise because one
would expect that the energy eigenstates of a classically chaotic system would
have amplitudes that on the average are uniformly spread over the energy surface.
The theorem of Schnirelman (1974), Colin de Verdiere (1985), and Zeldich (1987)
(the SZCdV theorem) would tend to support this. The SZCdV theorem states the
following: In the semiclassical limit, the expectation value of an operator is almost
always the microcanonical average of the classical function corresponding to the
operator (Agam and Fishman 1994). The existence of scars is now known to be
compatible with the SZCdV theorem. Although the fraction of strongly scarred
states remains finite in the limit ¯
h→0, the size of the scarred phase space region
surrounding the orbit scales with ¯
h and tends to zero in the limit ¯
h→0 (Kaplan and
Heller 2000).
213
Fig. 7.11 The upper figures are unstable periodic orbits of the classical stadium. The lower figures
show contour plots of the probability distribution, |ψ| 2 , for two energy eigenstates that appear to
be scarred by the classical orbits above them (Heller 1986)
Fig. 7.12 Experimentally
obtained eigenstates of the
microwave stadium billiard
for a stadium with parameters
a = 18 cm and r = 13.5 cm.
(a) Scarred eigenstate with
frequency f = 3.865 GHz.
(b) More typical eigenstate
with frequency
f = 7.250 GHz (Stein and
Stockmann 1992)
in both directions, yielding a grid in the x − y plane of 1555 data points. Two of
the microwave eigenstates are shown in Fig. 7.12. Figure 7.12a clearly corresponds
to a scarred eigenstate. Figure 7.12b is more representative of the vast majority of
eigenstates in the stadium billiard which are fairly uniformly distributed over the
area of the billiard. Figure 7.12b is somewhat distorted by the measuring probes
but still is interesting to see.
Scarring of the eigenstates of the stadium billiard was a surprise because one
would expect that the energy eigenstates of a classically chaotic system would
have amplitudes that on the average are uniformly spread over the energy surface.
The theorem of Schnirelman (1974), Colin de Verdiere (1985), and Zeldich (1987)
(the SZCdV theorem) would tend to support this. The SZCdV theorem states the
following: In the semiclassical limit, the expectation value of an operator is almost
always the microcanonical average of the classical function corresponding to the
operator (Agam and Fishman 1994). The existence of scars is now known to be
compatible with the SZCdV theorem. Although the fraction of strongly scarred
states remains finite in the limit ¯
h→0, the size of the scarred phase space region
surrounding the orbit scales with ¯
h and tends to zero in the limit ¯
h→0 (Kaplan and
Heller 2000).