

212
7 Bounded Quantum Systems
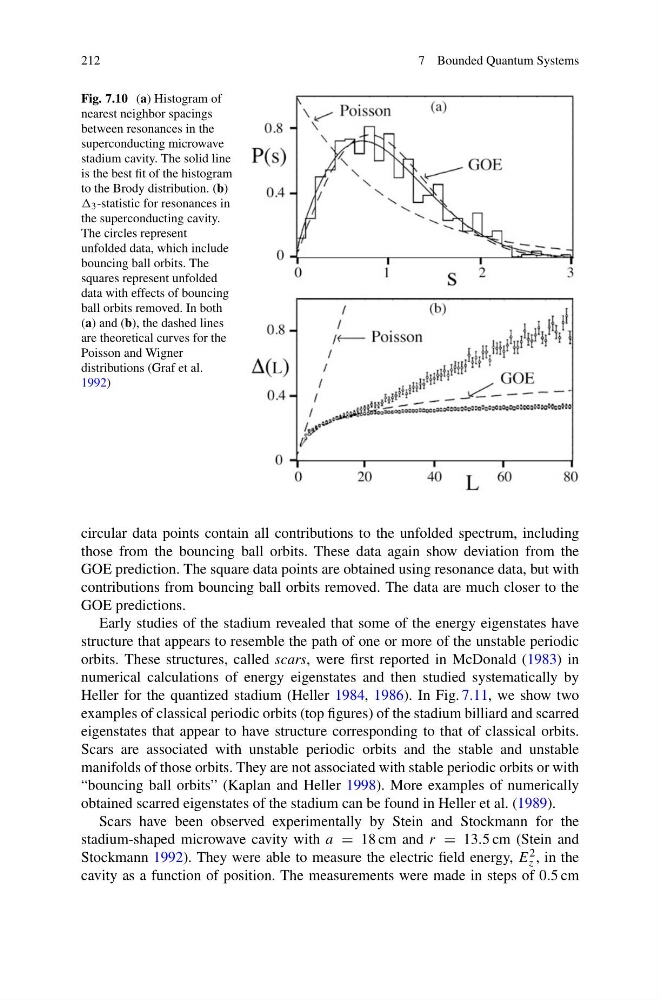
Fig. 7.10 (a) Histogram of
nearest neighbor spacings
between resonances in the
superconducting microwave
stadium cavity. The solid line
is the best fit of the histogram
to the Brody distribution. (b)
3 -statistic for resonances in
the superconducting cavity.
The circles represent
unfolded data, which include
bouncing ball orbits. The
squares represent unfolded
data with effects of bouncing
ball orbits removed. In both
(a) and (b), the dashed lines
are theoretical curves for the
Poisson and Wigner
distributions (Graf et al.
1992)
circular data points contain all contributions to the unfolded spectrum, including
those from the bouncing ball orbits. These data again show deviation from the
GOE prediction. The square data points are obtained using resonance data, but with
contributions from bouncing ball orbits removed. The data are much closer to the
GOE predictions.
Early studies of the stadium revealed that some of the energy eigenstates have
structure that appears to resemble the path of one or more of the unstable periodic
orbits. These structures, called scars, were first reported in McDonald (1983) in
numerical calculations of energy eigenstates and then studied systematically by
Heller for the quantized stadium (Heller 1984, 1986). In Fig. 7.11, we show two
examples of classical periodic orbits (top figures) of the stadium billiard and scarred
eigenstates that appear to have structure corresponding to that of classical orbits.
Scars are associated with unstable periodic orbits and the stable and unstable
manifolds of those orbits. They are not associated with stable periodic orbits or with
“bouncing ball orbits” (Kaplan and Heller 1998). More examples of numerically
obtained scarred eigenstates of the stadium can be found in Heller et al. (1989).
Scars have been observed experimentally by Stein and Stockmann for the
stadium-shaped microwave cavity with a = 18 cm and r = 13.5 cm (Stein and
Stockmann 1992). They were able to measure the electric field energy, E 2
z , in the
cavity as a function of position. The measurements were made in steps of 0.5 cm
7 Bounded Quantum Systems
Fig. 7.10 (a) Histogram of
nearest neighbor spacings
between resonances in the
superconducting microwave
stadium cavity. The solid line
is the best fit of the histogram
to the Brody distribution. (b)
3 -statistic for resonances in
the superconducting cavity.
The circles represent
unfolded data, which include
bouncing ball orbits. The
squares represent unfolded
data with effects of bouncing
ball orbits removed. In both
(a) and (b), the dashed lines
are theoretical curves for the
Poisson and Wigner
distributions (Graf et al.
1992)
circular data points contain all contributions to the unfolded spectrum, including
those from the bouncing ball orbits. These data again show deviation from the
GOE prediction. The square data points are obtained using resonance data, but with
contributions from bouncing ball orbits removed. The data are much closer to the
GOE predictions.
Early studies of the stadium revealed that some of the energy eigenstates have
structure that appears to resemble the path of one or more of the unstable periodic
orbits. These structures, called scars, were first reported in McDonald (1983) in
numerical calculations of energy eigenstates and then studied systematically by
Heller for the quantized stadium (Heller 1984, 1986). In Fig. 7.11, we show two
examples of classical periodic orbits (top figures) of the stadium billiard and scarred
eigenstates that appear to have structure corresponding to that of classical orbits.
Scars are associated with unstable periodic orbits and the stable and unstable
manifolds of those orbits. They are not associated with stable periodic orbits or with
“bouncing ball orbits” (Kaplan and Heller 1998). More examples of numerically
obtained scarred eigenstates of the stadium can be found in Heller et al. (1989).
Scars have been observed experimentally by Stein and Stockmann for the
stadium-shaped microwave cavity with a = 18 cm and r = 13.5 cm (Stein and
Stockmann 1992). They were able to measure the electric field energy, E 2
z , in the
cavity as a function of position. The measurements were made in steps of 0.5 cm