

7.5 Quantum Billiards
211
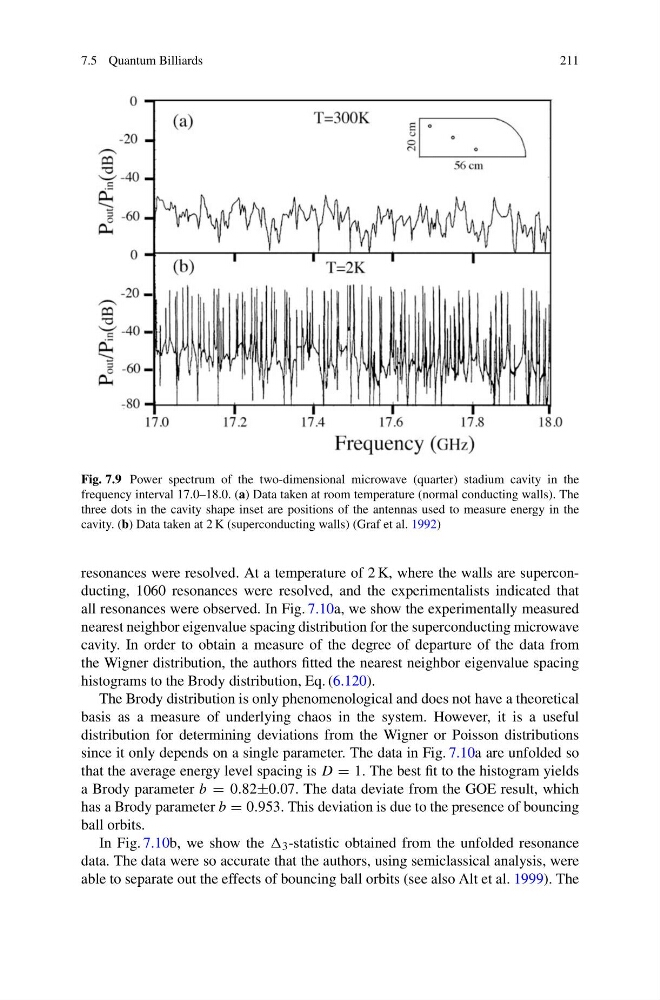
Fig. 7.9 Power spectrum of the two-dimensional microwave (quarter) stadium cavity in the
frequency interval 17.0–18.0. (a) Data taken at room temperature (normal conducting walls). The
three dots in the cavity shape inset are positions of the antennas used to measure energy in the
cavity. (b) Data taken at 2 K (superconducting walls) (Graf et al. 1992)
resonances were resolved. At a temperature of 2 K, where the walls are superconducting, 1060 resonances were resolved, and the experimentalists indicated that
all resonances were observed. In Fig. 7.10a, we show the experimentally measured
nearest neighbor eigenvalue spacing distribution for the superconducting microwave
cavity. In order to obtain a measure of the degree of departure of the data from
the Wigner distribution, the authors fitted the nearest neighbor eigenvalue spacing
histograms to the Brody distribution, Eq. (6.120).
The Brody distribution is only phenomenological and does not have a theoretical
basis as a measure of underlying chaos in the system. However, it is a useful
distribution for determining deviations from the Wigner or Poisson distributions
since it only depends on a single parameter. The data in Fig. 7.10a are unfolded so
that the average energy level spacing is D = 1. The best fit to the histogram yields
a Brody parameter b = 0.82±0.07. The data deviate from the GOE result, which
has a Brody parameter b = 0.953. This deviation is due to the presence of bouncing
ball orbits.
In Fig. 7.10b, we show the 3 -statistic obtained from the unfolded resonance
data. The data were so accurate that the authors, using semiclassical analysis, were
able to separate out the effects of bouncing ball orbits (see also Alt et al. 1999). The
211
Fig. 7.9 Power spectrum of the two-dimensional microwave (quarter) stadium cavity in the
frequency interval 17.0–18.0. (a) Data taken at room temperature (normal conducting walls). The
three dots in the cavity shape inset are positions of the antennas used to measure energy in the
cavity. (b) Data taken at 2 K (superconducting walls) (Graf et al. 1992)
resonances were resolved. At a temperature of 2 K, where the walls are superconducting, 1060 resonances were resolved, and the experimentalists indicated that
all resonances were observed. In Fig. 7.10a, we show the experimentally measured
nearest neighbor eigenvalue spacing distribution for the superconducting microwave
cavity. In order to obtain a measure of the degree of departure of the data from
the Wigner distribution, the authors fitted the nearest neighbor eigenvalue spacing
histograms to the Brody distribution, Eq. (6.120).
The Brody distribution is only phenomenological and does not have a theoretical
basis as a measure of underlying chaos in the system. However, it is a useful
distribution for determining deviations from the Wigner or Poisson distributions
since it only depends on a single parameter. The data in Fig. 7.10a are unfolded so
that the average energy level spacing is D = 1. The best fit to the histogram yields
a Brody parameter b = 0.82±0.07. The data deviate from the GOE result, which
has a Brody parameter b = 0.953. This deviation is due to the presence of bouncing
ball orbits.
In Fig. 7.10b, we show the 3 -statistic obtained from the unfolded resonance
data. The data were so accurate that the authors, using semiclassical analysis, were
able to separate out the effects of bouncing ball orbits (see also Alt et al. 1999). The