

174
6 Quantum Dynamics and Random Matrix Theory
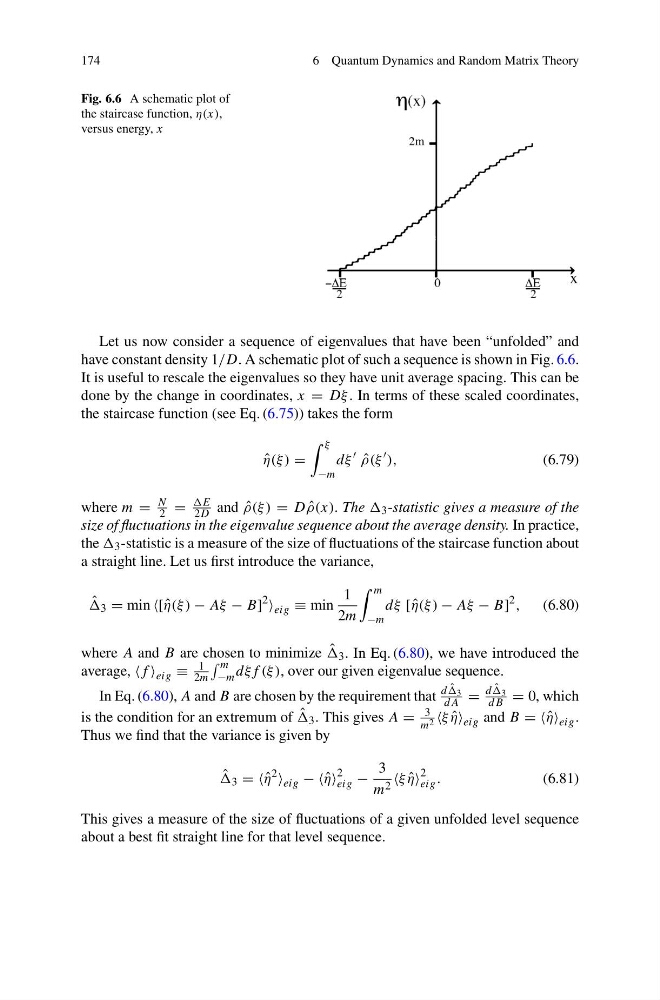
Fig. 6.6 A schematic plot of
the staircase function, η(x),
versus energy, x
Let us now consider a sequence of eigenvalues that have been “unfolded” and
have constant density 1/D. A schematic plot of such a sequence is shown in Fig. 6.6.
It is useful to rescale the eigenvalues so they have unit average spacing. This can be
done by the change in coordinates, x = Dξ . In terms of these scaled coordinates,
the staircase function (see Eq. (6.75)) takes the form
ˆ
η(ξ ) =
ξ
−m
dξ
ˆ
ρ(ξ
),
(6.79)
where m =
N
2 =
2D and ˆ
ρ(ξ ) = D ˆ
ρ(x). The 3 -statistic gives a measure of the
size of fluctuations in the eigenvalue sequence about the average density. In practice,
the 3 -statistic is a measure of the size of fluctuations of the staircase function about
a straight line. Let us first introduce the variance,
ˆ
3 = min [ ˆ
η(ξ ) − Aξ − B]
2
eig ≡ min
1
2m
m
−m
dξ [ ˆ
η(ξ ) − Aξ − B]
2 ,
(6.80)
where A and B are chosen to minimize ˆ
3 . In Eq. (6.80), we have introduced the
average, eig ≡
1
2m
m
−m dξf (ξ ), over our given eigenvalue sequence.
In Eq. (6.80), A and B are chosen by the requirement that
d ˆ
3
dA =
d ˆ
3
dB = 0, which
is the condition for an extremum of ˆ
3 . This gives A =
3
m 2 ˆ
η eig and B = = ˆ
η eig .
Thus we find that the variance is given by
ˆ
3 = = ˆ
η
2
eig − − ˆ
η
2
eig −
3
m 2 ˆ
η
2
eig .
(6.81)
This gives a measure of the size of fluctuations of a given unfolded level sequence
about a best fit straight line for that level sequence.
6 Quantum Dynamics and Random Matrix Theory
Fig. 6.6 A schematic plot of
the staircase function, η(x),
versus energy, x
Let us now consider a sequence of eigenvalues that have been “unfolded” and
have constant density 1/D. A schematic plot of such a sequence is shown in Fig. 6.6.
It is useful to rescale the eigenvalues so they have unit average spacing. This can be
done by the change in coordinates, x = Dξ . In terms of these scaled coordinates,
the staircase function (see Eq. (6.75)) takes the form
ˆ
η(ξ ) =
ξ
−m
dξ
ˆ
ρ(ξ
),
(6.79)
where m =
N
2 =
2D and ˆ
ρ(ξ ) = D ˆ
ρ(x). The 3 -statistic gives a measure of the
size of fluctuations in the eigenvalue sequence about the average density. In practice,
the 3 -statistic is a measure of the size of fluctuations of the staircase function about
a straight line. Let us first introduce the variance,
ˆ
3 = min [ ˆ
η(ξ ) − Aξ − B]
2
eig ≡ min
1
2m
m
−m
dξ [ ˆ
η(ξ ) − Aξ − B]
2 ,
(6.80)
where A and B are chosen to minimize ˆ
3 . In Eq. (6.80), we have introduced the
average, eig ≡
1
2m
m
−m dξf (ξ ), over our given eigenvalue sequence.
In Eq. (6.80), A and B are chosen by the requirement that
d ˆ
3
dA =
d ˆ
3
dB = 0, which
is the condition for an extremum of ˆ
3 . This gives A =
3
m 2 ˆ
η eig and B = = ˆ
η eig .
Thus we find that the variance is given by
ˆ
3 = = ˆ
η
2
eig − − ˆ
η
2
eig −
3
m 2 ˆ
η
2
eig .
(6.81)
This gives a measure of the size of fluctuations of a given unfolded level sequence
about a best fit straight line for that level sequence.