

The model results were validated by comparison to the observed values at the
measurement stations inside the domain. The methodology proposed by
FAIRMODE (see: Thunis et al. 2012, 2013; Pernigotti et al. 2013) was adopted.
Briefly put, the methodology accounts for observation uncertainty in the evaluation
of model results and proposes a method to decide whether model results are
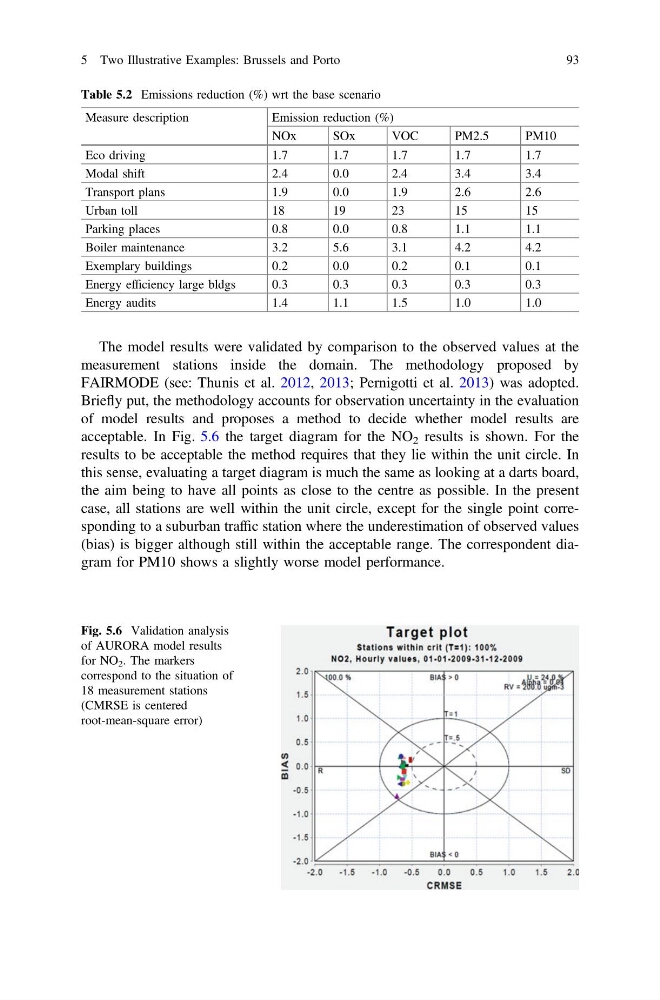
acceptable. In Fig. 5.6 the target diagram for the NO 2 results is shown. For the
results to be acceptable the method requires that they lie within the unit circle. In
this sense, evaluating a target diagram is much the same as looking at a darts board,
the aim being to have all points as close to the centre as possible. In the present
case, all stations are well within the unit circle, except for the single point corresponding to a suburban traffic station where the underestimation of observed values
(bias) is bigger although still within the acceptable range. The correspondent diagram for PM10 shows a slightly worse model performance.
Table 5.2 Emissions reduction (%) wrt the base scenario
Measure description
Emission reduction (%)
NOx
SOx
VOC
PM2.5
PM10
Eco driving
1.7
1.7
1.7
1.7
1.7
Modal shift
2.4
0.0
2.4
3.4
3.4
Transport plans
1.9
0.0
1.9
2.6
2.6
Urban toll
18
19
23
15
15
Parking places
0.8
0.0
0.8
1.1
1.1
Boiler maintenance
3.2
5.6
3.1
4.2
4.2
Exemplary buildings
0.2
0.0
0.2
0.1
0.1
Energy efficiency large bldgs
0.3
0.3
0.3
0.3
0.3
Energy audits
1.4
1.1
1.5
1.0
1.0
Fig. 5.6 Validation analysis
of AURORA model results
for NO 2 . The markers
correspond to the situation of
18 measurement stations
(CMRSE is centered
root-mean-square error)
5 Two Illustrative Examples: Brussels and Porto
93
measurement stations inside the domain. The methodology proposed by
FAIRMODE (see: Thunis et al. 2012, 2013; Pernigotti et al. 2013) was adopted.
Briefly put, the methodology accounts for observation uncertainty in the evaluation
of model results and proposes a method to decide whether model results are
acceptable. In Fig. 5.6 the target diagram for the NO 2 results is shown. For the
results to be acceptable the method requires that they lie within the unit circle. In
this sense, evaluating a target diagram is much the same as looking at a darts board,
the aim being to have all points as close to the centre as possible. In the present
case, all stations are well within the unit circle, except for the single point corresponding to a suburban traffic station where the underestimation of observed values
(bias) is bigger although still within the acceptable range. The correspondent diagram for PM10 shows a slightly worse model performance.
Table 5.2 Emissions reduction (%) wrt the base scenario
Measure description
Emission reduction (%)
NOx
SOx
VOC
PM2.5
PM10
Eco driving
1.7
1.7
1.7
1.7
1.7
Modal shift
2.4
0.0
2.4
3.4
3.4
Transport plans
1.9
0.0
1.9
2.6
2.6
Urban toll
18
19
23
15
15
Parking places
0.8
0.0
0.8
1.1
1.1
Boiler maintenance
3.2
5.6
3.1
4.2
4.2
Exemplary buildings
0.2
0.0
0.2
0.1
0.1
Energy efficiency large bldgs
0.3
0.3
0.3
0.3
0.3
Energy audits
1.4
1.1
1.5
1.0
1.0
Fig. 5.6 Validation analysis
of AURORA model results
for NO 2 . The markers
correspond to the situation of
18 measurement stations
(CMRSE is centered
root-mean-square error)
5 Two Illustrative Examples: Brussels and Porto
93