

5.3.3 Design of Experiments and Source/Receptor Models
For the Design of Experiment phase, three levels of emission within BCR were
distinguished: base case (B), high emission reductions (H) and low emission
reductions (L). They correspond to the following assumptions:
• The B emission level corresponds to the CLE2020 emissions, increased by
20 %.
• The H level is obtained by projecting the 2009 regional emission inventory to
2020 with the projected application rates of all technologies (as predicted by the
GAINS inventory).
• The L level (low emission reductions) is obtained as the average of B and H.
The emission levels for the model grid cells outside the BCR were also changed
according to the changes inside the BCR, while for the boundary conditions of the
49 Â 49 km domain, the average emission variation from the 2009 inventory
projected to CLE2020 of the BCR domain cells was applied to the emission
inventory covering all Belgium.
To determine the emission reduction scenarios for the ANN training, the three
levels B, H, L were combined to produce 14 different emission sets.
The selected Air Quality Indexes (AQIs) were: yearly average of PM10 concentrations and yearly average of NO 2 concentrations. The emissions surrounding
individual model grid cells were aggregated according to the quadrants in Fig. 5.1
with a dimension of 14 cells for PM10 and of 20 cells for NO 2 .
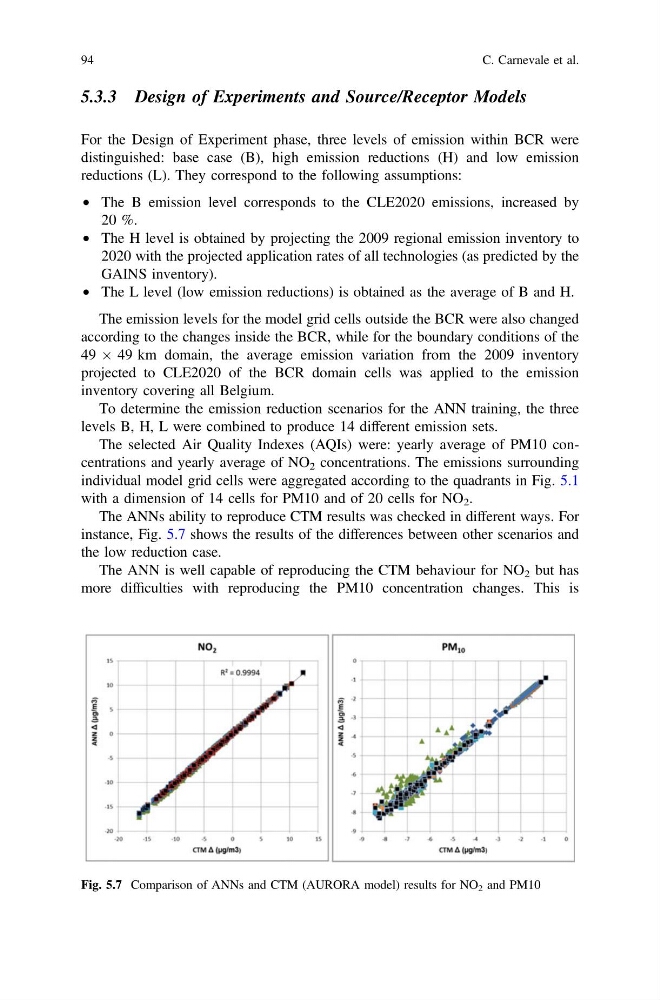
The ANNs ability to reproduce CTM results was checked in different ways. For
instance, Fig. 5.7 shows the results of the differences between other scenarios and
the low reduction case.
The ANN is well capable of reproducing the CTM behaviour for NO 2 but has
more difficulties with reproducing the PM10 concentration changes. This is
Fig. 5.7 Comparison of ANNs and CTM (AURORA model) results for NO 2 and PM10
94
C. Carnevale et al.
For the Design of Experiment phase, three levels of emission within BCR were
distinguished: base case (B), high emission reductions (H) and low emission
reductions (L). They correspond to the following assumptions:
• The B emission level corresponds to the CLE2020 emissions, increased by
20 %.
• The H level is obtained by projecting the 2009 regional emission inventory to
2020 with the projected application rates of all technologies (as predicted by the
GAINS inventory).
• The L level (low emission reductions) is obtained as the average of B and H.
The emission levels for the model grid cells outside the BCR were also changed
according to the changes inside the BCR, while for the boundary conditions of the
49 Â 49 km domain, the average emission variation from the 2009 inventory
projected to CLE2020 of the BCR domain cells was applied to the emission
inventory covering all Belgium.
To determine the emission reduction scenarios for the ANN training, the three
levels B, H, L were combined to produce 14 different emission sets.
The selected Air Quality Indexes (AQIs) were: yearly average of PM10 concentrations and yearly average of NO 2 concentrations. The emissions surrounding
individual model grid cells were aggregated according to the quadrants in Fig. 5.1
with a dimension of 14 cells for PM10 and of 20 cells for NO 2 .
The ANNs ability to reproduce CTM results was checked in different ways. For
instance, Fig. 5.7 shows the results of the differences between other scenarios and
the low reduction case.
The ANN is well capable of reproducing the CTM behaviour for NO 2 but has
more difficulties with reproducing the PM10 concentration changes. This is
Fig. 5.7 Comparison of ANNs and CTM (AURORA model) results for NO 2 and PM10
94
C. Carnevale et al.