

especially true for a model run in which only the NOx emissions are changed
(represented by small triangles in the figure). For this last case, the average normalised bias amounts to 3.6 % with extreme values of up to 33 % whereas for all
the other scenarios the average normalised bias is less than 0.25 %.
5.3.4 Results
The application of RIAT+ allows to quickly compute the impacts of any combination of measures. In particular, for BCR, the concentration patterns were
examined, together with the distribution of YOLLs assuming a uniform population
density in the area.
Even assuming all the measures are in place, the emission changes are limited,
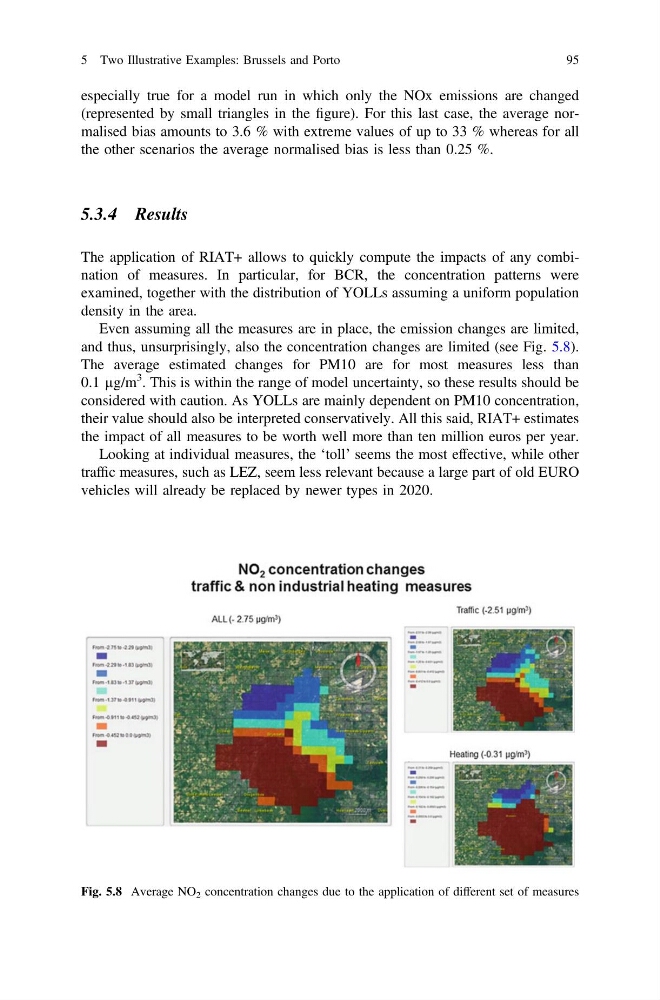
and thus, unsurprisingly, also the concentration changes are limited (see Fig. 5.8).
The average estimated changes for PM10 are for most measures less than
0.1 µg/m
3 . This is within the range of model uncertainty, so these results should be
considered with caution. As YOLLs are mainly dependent on PM10 concentration,
their value should also be interpreted conservatively. All this said, RIAT+ estimates
the impact of all measures to be worth well more than ten million euros per year.
Looking at individual measures, the ‘toll’ seems the most effective, while other
traffic measures, such as LEZ, seem less relevant because a large part of old EURO
vehicles will already be replaced by newer types in 2020.
Fig. 5.8 Average NO 2 concentration changes due to the application of different set of measures
5 Two Illustrative Examples: Brussels and Porto
95
(represented by small triangles in the figure). For this last case, the average normalised bias amounts to 3.6 % with extreme values of up to 33 % whereas for all
the other scenarios the average normalised bias is less than 0.25 %.
5.3.4 Results
The application of RIAT+ allows to quickly compute the impacts of any combination of measures. In particular, for BCR, the concentration patterns were
examined, together with the distribution of YOLLs assuming a uniform population
density in the area.
Even assuming all the measures are in place, the emission changes are limited,
and thus, unsurprisingly, also the concentration changes are limited (see Fig. 5.8).
The average estimated changes for PM10 are for most measures less than
0.1 µg/m
3 . This is within the range of model uncertainty, so these results should be
considered with caution. As YOLLs are mainly dependent on PM10 concentration,
their value should also be interpreted conservatively. All this said, RIAT+ estimates
the impact of all measures to be worth well more than ten million euros per year.
Looking at individual measures, the ‘toll’ seems the most effective, while other
traffic measures, such as LEZ, seem less relevant because a large part of old EURO
vehicles will already be replaced by newer types in 2020.
Fig. 5.8 Average NO 2 concentration changes due to the application of different set of measures
5 Two Illustrative Examples: Brussels and Porto
95