

mandatory under city government regulations. It is estimated to reduce NOx
emission by about 24 ton in 2020, VOC emissions by slightly more than 3 tons
and only by 0.6 ton PM2.5. The cost has not being evaluated since they are part
of CLE 2020.
5.3.2 The 2010 Scenario
The starting situation for the simulations was a reconstruction of 2010 situation
based on the emission inventory of the previous year. For the two sectors involved,
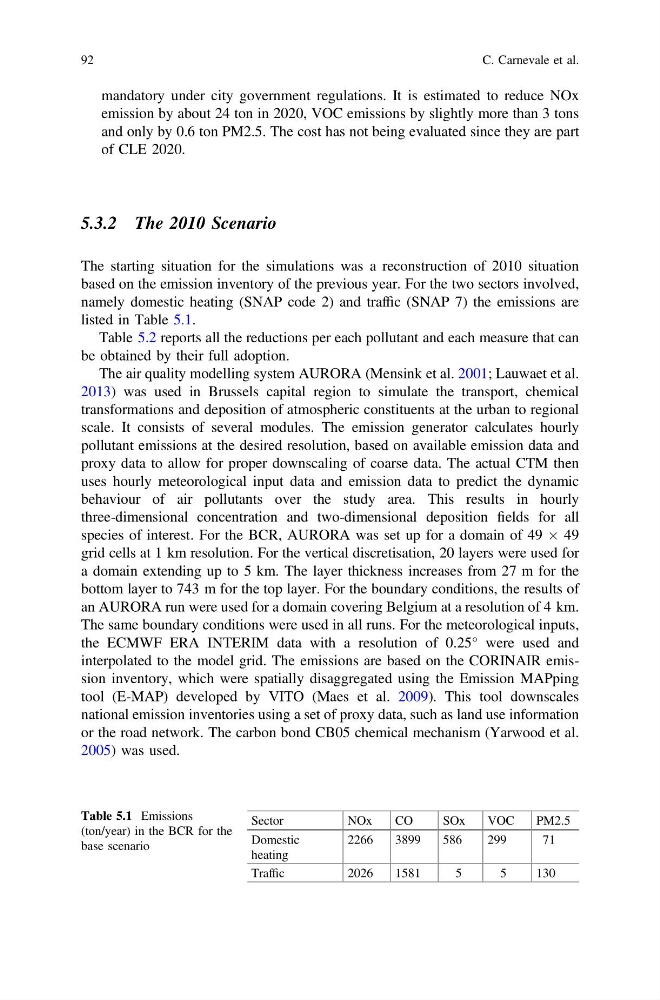
namely domestic heating (SNAP code 2) and traffic (SNAP 7) the emissions are
listed in Table 5.1.
Table 5.2 reports all the reductions per each pollutant and each measure that can
be obtained by their full adoption.
The air quality modelling system AURORA (Mensink et al. 2001; Lauwaet et al.
2013) was used in Brussels capital region to simulate the transport, chemical
transformations and deposition of atmospheric constituents at the urban to regional
scale. It consists of several modules. The emission generator calculates hourly
pollutant emissions at the desired resolution, based on available emission data and
proxy data to allow for proper downscaling of coarse data. The actual CTM then
uses hourly meteorological input data and emission data to predict the dynamic
behaviour of air pollutants over the study area. This results in hourly
three-dimensional concentration and two-dimensional deposition fields for all
species of interest. For the BCR, AURORA was set up for a domain of 49 Â 49
grid cells at 1 km resolution. For the vertical discretisation, 20 layers were used for
a domain extending up to 5 km. The layer thickness increases from 27 m for the
bottom layer to 743 m for the top layer. For the boundary conditions, the results of
an AURORA run were used for a domain covering Belgium at a resolution of 4 km.
The same boundary conditions were used in all runs. For the meteorological inputs,
the ECMWF ERA INTERIM data with a resolution of 0.25° were used and
interpolated to the model grid. The emissions are based on the CORINAIR emission inventory, which were spatially disaggregated using the Emission MAPping
tool (E-MAP) developed by VITO (Maes et al. 2009). This tool downscales
national emission inventories using a set of proxy data, such as land use information
or the road network. The carbon bond CB05 chemical mechanism (Yarwood et al.
2005) was used.
Table 5.1 Emissions
(ton/year) in the BCR for the
base scenario
Sector
NOx
CO
SOx
VOC
PM2.5
Domestic
heating
2266
3899
586
299
71
Traffic
2026
1581
5
5
130
92
C. Carnevale et al.
emission by about 24 ton in 2020, VOC emissions by slightly more than 3 tons
and only by 0.6 ton PM2.5. The cost has not being evaluated since they are part
of CLE 2020.
5.3.2 The 2010 Scenario
The starting situation for the simulations was a reconstruction of 2010 situation
based on the emission inventory of the previous year. For the two sectors involved,
namely domestic heating (SNAP code 2) and traffic (SNAP 7) the emissions are
listed in Table 5.1.
Table 5.2 reports all the reductions per each pollutant and each measure that can
be obtained by their full adoption.
The air quality modelling system AURORA (Mensink et al. 2001; Lauwaet et al.
2013) was used in Brussels capital region to simulate the transport, chemical
transformations and deposition of atmospheric constituents at the urban to regional
scale. It consists of several modules. The emission generator calculates hourly
pollutant emissions at the desired resolution, based on available emission data and
proxy data to allow for proper downscaling of coarse data. The actual CTM then
uses hourly meteorological input data and emission data to predict the dynamic
behaviour of air pollutants over the study area. This results in hourly
three-dimensional concentration and two-dimensional deposition fields for all
species of interest. For the BCR, AURORA was set up for a domain of 49 Â 49
grid cells at 1 km resolution. For the vertical discretisation, 20 layers were used for
a domain extending up to 5 km. The layer thickness increases from 27 m for the
bottom layer to 743 m for the top layer. For the boundary conditions, the results of
an AURORA run were used for a domain covering Belgium at a resolution of 4 km.
The same boundary conditions were used in all runs. For the meteorological inputs,
the ECMWF ERA INTERIM data with a resolution of 0.25° were used and
interpolated to the model grid. The emissions are based on the CORINAIR emission inventory, which were spatially disaggregated using the Emission MAPping
tool (E-MAP) developed by VITO (Maes et al. 2009). This tool downscales
national emission inventories using a set of proxy data, such as land use information
or the road network. The carbon bond CB05 chemical mechanism (Yarwood et al.
2005) was used.
Table 5.1 Emissions
(ton/year) in the BCR for the
base scenario
Sector
NOx
CO
SOx
VOC
PM2.5
Domestic
heating
2266
3899
586
299
71
Traffic
2026
1581
5
5
130
92
C. Carnevale et al.