

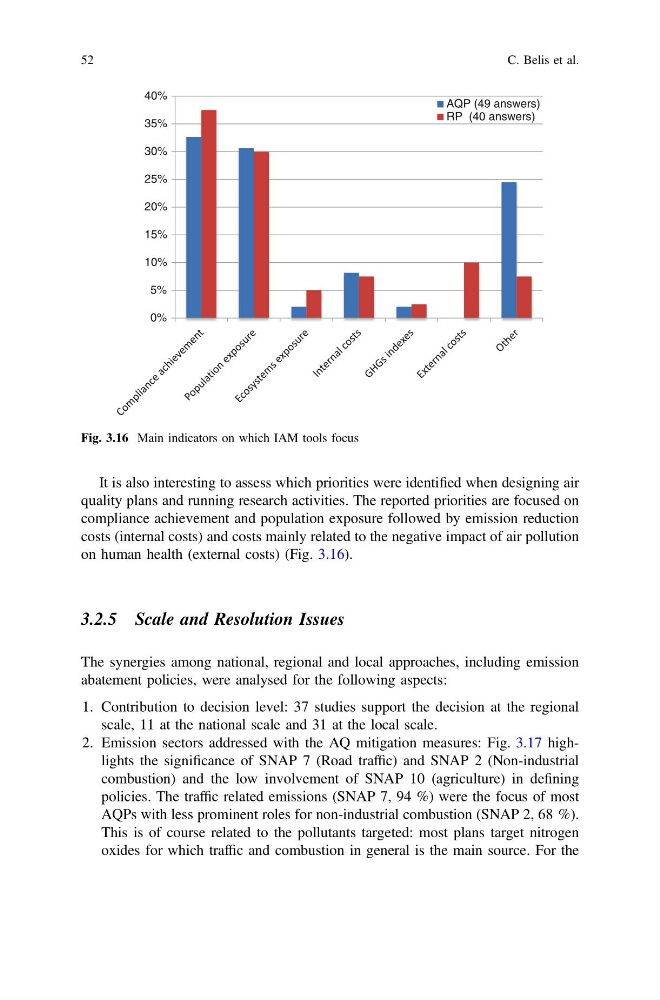
It is also interesting to assess which priorities were identified when designing air
quality plans and running research activities. The reported priorities are focused on
compliance achievement and population exposure followed by emission reduction
costs (internal costs) and costs mainly related to the negative impact of air pollution
on human health (external costs) (Fig. 3.16).
3.2.5 Scale and Resolution Issues
The synergies among national, regional and local approaches, including emission
abatement policies, were analysed for the following aspects:
1. Contribution to decision level: 37 studies support the decision at the regional
scale, 11 at the national scale and 31 at the local scale.
2. Emission sectors addressed with the AQ mitigation measures: Fig. 3.17 highlights the significance of SNAP 7 (Road traffic) and SNAP 2 (Non-industrial
combustion) and the low involvement of SNAP 10 (agriculture) in defining
policies. The traffic related emissions (SNAP 7, 94 %) were the focus of most
AQPs with less prominent roles for non-industrial combustion (SNAP 2, 68 %).
This is of course related to the pollutants targeted: most plans target nitrogen
oxides for which traffic and combustion in general is the main source. For the
0%
5%
10%
15%
20%
25%
30%
35%
40%
AQP (49 answers)
RP (40 answers)
Fig. 3.16 Main indicators on which IAM tools focus
52
C. Belis et al.
quality plans and running research activities. The reported priorities are focused on
compliance achievement and population exposure followed by emission reduction
costs (internal costs) and costs mainly related to the negative impact of air pollution
on human health (external costs) (Fig. 3.16).
3.2.5 Scale and Resolution Issues
The synergies among national, regional and local approaches, including emission
abatement policies, were analysed for the following aspects:
1. Contribution to decision level: 37 studies support the decision at the regional
scale, 11 at the national scale and 31 at the local scale.
2. Emission sectors addressed with the AQ mitigation measures: Fig. 3.17 highlights the significance of SNAP 7 (Road traffic) and SNAP 2 (Non-industrial
combustion) and the low involvement of SNAP 10 (agriculture) in defining
policies. The traffic related emissions (SNAP 7, 94 %) were the focus of most
AQPs with less prominent roles for non-industrial combustion (SNAP 2, 68 %).
This is of course related to the pollutants targeted: most plans target nitrogen
oxides for which traffic and combustion in general is the main source. For the
0%
5%
10%
15%
20%
25%
30%
35%
40%
AQP (49 answers)
RP (40 answers)
Fig. 3.16 Main indicators on which IAM tools focus
52
C. Belis et al.