

sector/source category. The frequency of such categories reflects the most commonly encountered pollution sources. Nevertheless, this is also influenced by the
availability of source characterization studies and the existence of mandatory
emission registers.
The most important pollutants considered in source apportionment studies are
PM10 (84 %) and nitrogen dioxide (63 %) followed by two pollutants associated to
them: PM2.5 (63 %) and nitrogen oxides (28 %), respectively. All the other pollutants are treated in less than 10 % of the studies.
The great majority of the studies focus on the city level (35 %) while local
(lower than city) and regional scales represent a 32 and 22 % respectively. The
country scale is marginally assessed (7 %).
The types of input data strongly depend on the adopted methodology.
Monitoring networks and emission inventories are the most frequent sources of
information (20 % each). Meteorological fields are input in 36 % of the answers
while dedicated field campaigns represent the 16 %.
In the optimization approach, the emission reduction measures are selected by an
optimization algorithm assessing their impact on air quality, health exposure, and
implementation costs. Such optimization algorithms requires thousands of air
quality assessments; in these cases, AQ systems cannot directly be used because of
the computing time demand, so they provide tens to hundreds simulations processed to identify ‘simple’ emissions-AQ links (source/receptor relationships).
IAM approaches based on cost-benefit, cost-effectiveness or on multi-objective
(i.e. optimization) approaches are used more often in research projects (61 %) than
in AQPs (35 %). One explanation for this low proportion in the AQPs might be the
fact that optimization approaches generally require extensive work to derive relationships to link emissions to air quality (source/receptor relationships) and to
collect data related to emission reduction measures and costs and to externalities.
Indeed these approaches cannot embed full 3D deterministic multi-phase modelling
systems because of their prohibitive computational requirements.
21%
56%
2%
6%
15%
AQP/RP (48 answers)
Receptor modelling
Dispersion modelling
Inverse modelling
Objective estimation techniques
Other
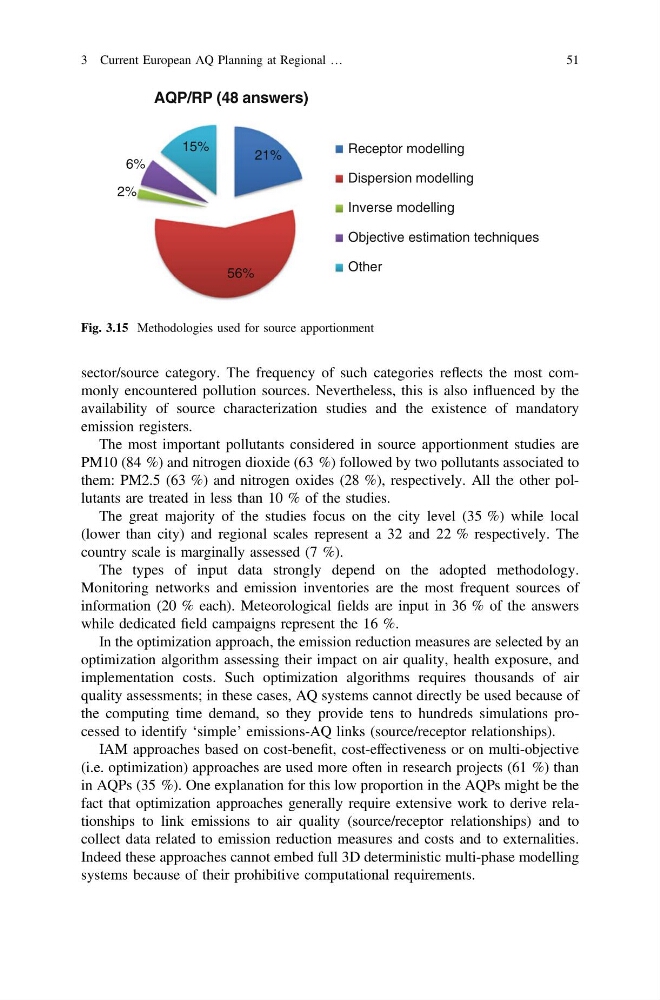
Fig. 3.15 Methodologies used for source apportionment
3 Current European AQ Planning at Regional …
51
availability of source characterization studies and the existence of mandatory
emission registers.
The most important pollutants considered in source apportionment studies are
PM10 (84 %) and nitrogen dioxide (63 %) followed by two pollutants associated to
them: PM2.5 (63 %) and nitrogen oxides (28 %), respectively. All the other pollutants are treated in less than 10 % of the studies.
The great majority of the studies focus on the city level (35 %) while local
(lower than city) and regional scales represent a 32 and 22 % respectively. The
country scale is marginally assessed (7 %).
The types of input data strongly depend on the adopted methodology.
Monitoring networks and emission inventories are the most frequent sources of
information (20 % each). Meteorological fields are input in 36 % of the answers
while dedicated field campaigns represent the 16 %.
In the optimization approach, the emission reduction measures are selected by an
optimization algorithm assessing their impact on air quality, health exposure, and
implementation costs. Such optimization algorithms requires thousands of air
quality assessments; in these cases, AQ systems cannot directly be used because of
the computing time demand, so they provide tens to hundreds simulations processed to identify ‘simple’ emissions-AQ links (source/receptor relationships).
IAM approaches based on cost-benefit, cost-effectiveness or on multi-objective
(i.e. optimization) approaches are used more often in research projects (61 %) than
in AQPs (35 %). One explanation for this low proportion in the AQPs might be the
fact that optimization approaches generally require extensive work to derive relationships to link emissions to air quality (source/receptor relationships) and to
collect data related to emission reduction measures and costs and to externalities.
Indeed these approaches cannot embed full 3D deterministic multi-phase modelling
systems because of their prohibitive computational requirements.
21%
56%
2%
6%
15%
AQP/RP (48 answers)
Receptor modelling
Dispersion modelling
Inverse modelling
Objective estimation techniques
Other
Fig. 3.15 Methodologies used for source apportionment
3 Current European AQ Planning at Regional …
51